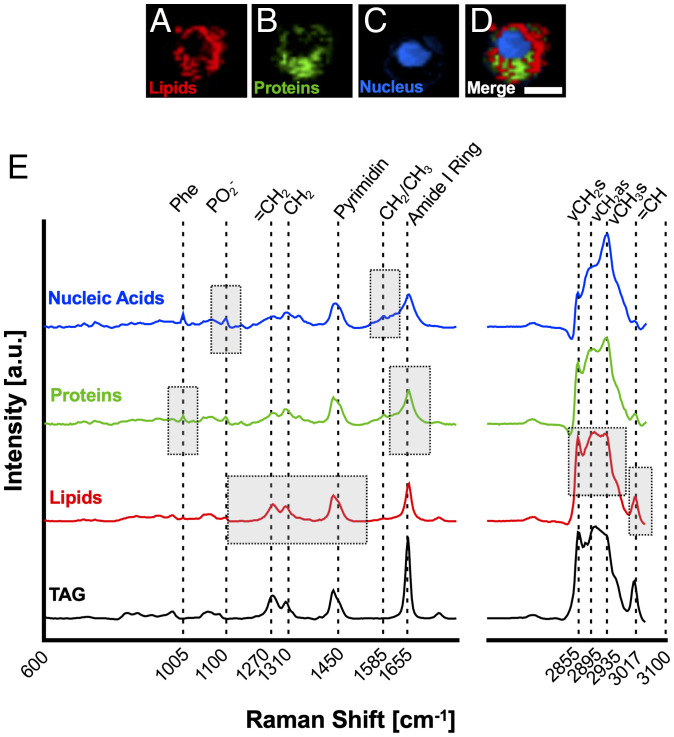
Fig. 2.
Raman imaging resolves subcellular structures in MDMs. Identification of major cell component Raman signatures present in MDMs. (A–D) False color heat maps of (A) lipids (red), (B) proteins (green), (C) nucleic acids (blue), and (D) merged as identified by TCA. (Scale bar, 10 µm.) (E) Spectral fingerprints of MDM components. Boxes represent spectral areas typically associated with the biochemical fingerprint of the respective cell component. Phe = Phenylalanin, ν = stretching, s = symmetric, as = asymmetric. A typical, in house–measured TAG spectrum is shown for comparison.

