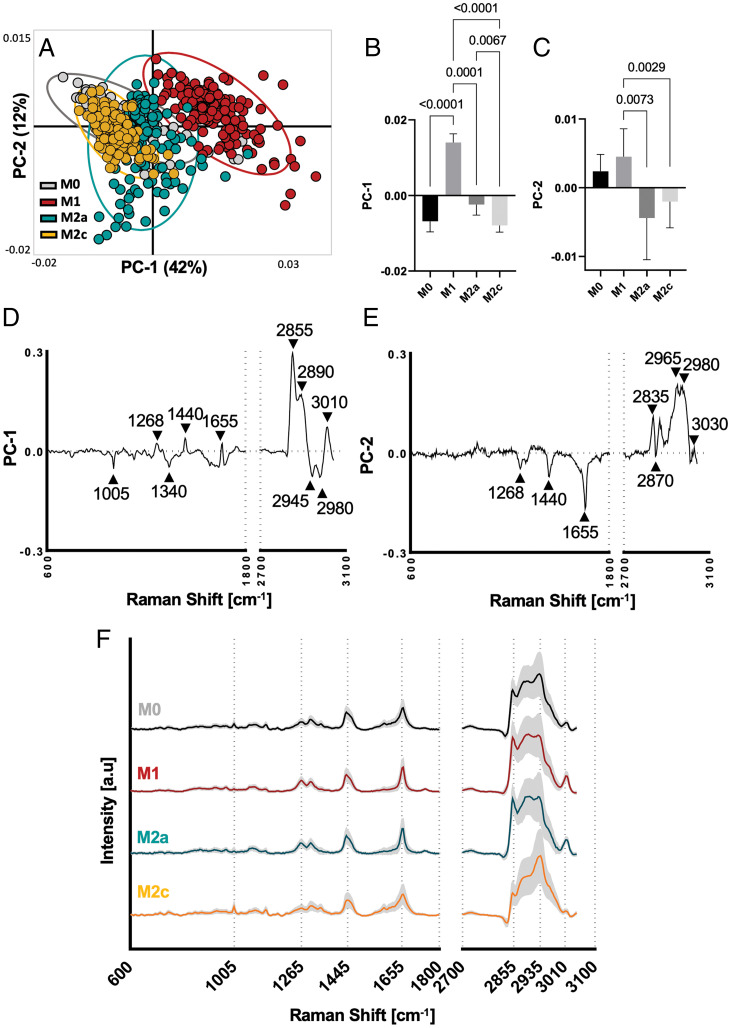
Fig. 3.
PCA of Raman lipid spectra identifies significant differences between polarized MDMs. (A) Scatter plot of PC-1 (42%) and PC-2 (12%) visualizes spatial clustering of MDM polarization (confidence ellipse = 95%; each dot represents a single cell). (B and C) Statistical analyses of scores from PC-1 and PC-2 reveal significant differences between all four subtypes; one way ANOVA and Tukey’s post hoc test, n = 6. (D and E) Loading plots describing major Raman peaks contribute to PCA separation. Peak assignments are listed in SI Appendix, Table 1. (F) Average lipid component Raman spectra of polarized MDMs with subtypes shown in black (M0), red (M1), blue (M2a), and yellow (M2c).

