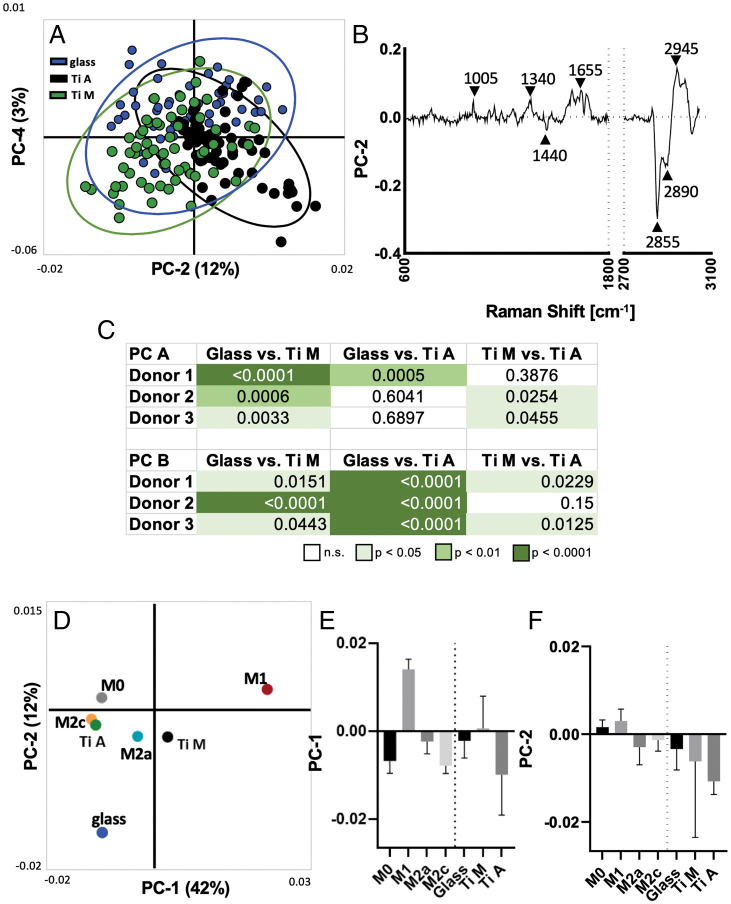
Fig. 5.
RM lipid spectra can be used to distinguish substrate-adherent MDMs, and projected scores indicate proximity to polarization status. (A) Scatter plot of PC-2 (12%) and PC-4 (3%) visualizes spatial clustering of substrate-adherent MDMs (confidence ellipse = 95%; each dot represents a single cell). (B) Loading plot of PC-2 describes major Raman peaks contributing to PCA separation, comparable to those observed in polarized MDMs. (C) Statistical analysis of relevant components (PC A and PC B) reveal significant differences within single donors between substrates. (D) Projection of average substrate-adherent MDM scores into the PCA scores plot of the polarized MDMs. (E and F) Statistical comparison of mean score values ± SD. Only the projected scores were analyzed for significance using the Kruskal–Wallis and Dunn’s post hoc tests.

