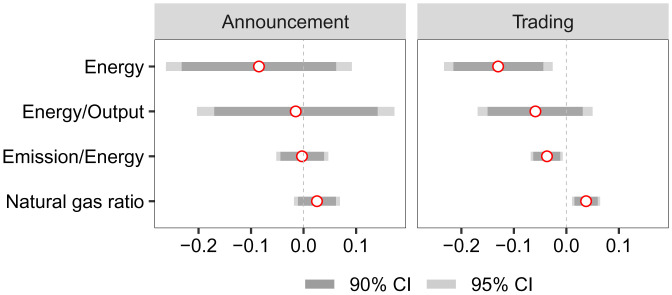
Fig. 1.
The channels of carbon emission reductions. The dependent variables except for natural gas ratio are in log form (y axis). (Left) Announcement designates the ETS effects during the announcement period (2011 to 2012). (Right) Trading designates the ETS effects during the trading period (2013 to 2015). Firm and year fixed effects, as well as province linear trend and industry linear trend, are included.

