Fig. 4.
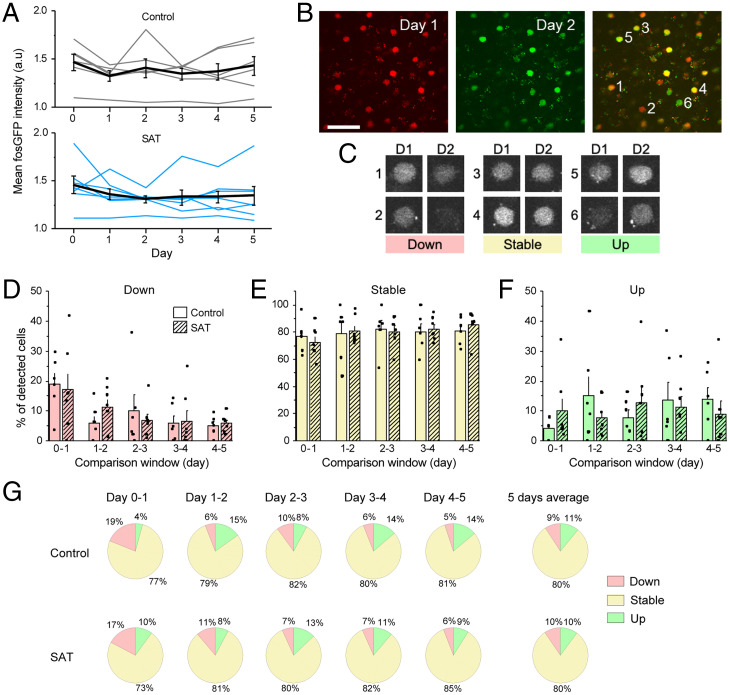
SAT does not alter the dynamics of fosGFP expression within individual cells. (A) (Top) Mean fosGFP intensity across all detected cells across 5 d of control. Gray lines indicate individual mice. Black line, mean ± SEM across six mice. (Bottom) Same as Top for SAT. n = 7 mice. (B) Example images of fosGFP-expressing cells in barrel cortex L2/3 across 2 d in a normal home cage. Day 1, red pseudocolor; day 2, green pseudocolor. Cells expressing similar levels of fosGFP on both days show yellow pseudocolor in overlay. (Scale bar, 50 μm.) (C) Example down, stable, and up cells from the overlay image in B. Cells were defined as down, stable, or up based on the relative intensity of fosGFP compared to the previous day. (D) Fraction (mean ± SEM) of “down” cells out of all detected cells in each 24-h window. n = 6 (control), 7 (SAT) mice. Two-sample t test between control and SAT, all nonsignificant. (E) Same as in D for “stable” cells. (F) Same as in D for “up” cells. (G) Fractions of down, stable, and up cells during each 24-h window and average across all 5 d for control and SAT.

