Fig. 7.
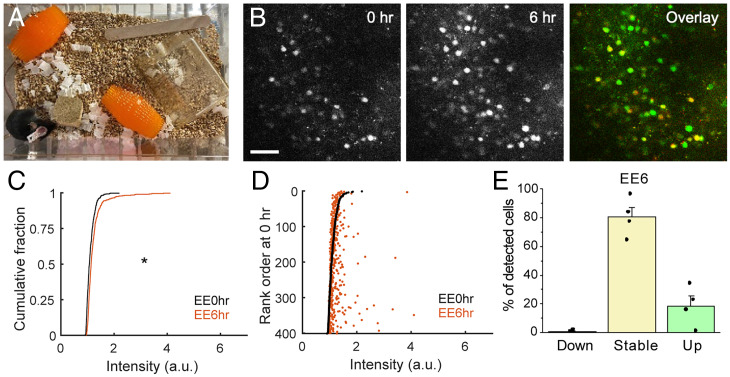
Enriched environment enhances fosGFP expression. (A) Enrichment items placed in a standard cage. (B) Example images of fosGFP-expressing cells in the barrel cortex L2/3 before enrichment (0 h) and 6 h after enrichment. In overlay, red channel, 0 h, green channel, 6 h. (Scale bar, 50 μm.) (C) Comparison of the distribution of fosGFP intensities before enrichment (EE0hr) and 6 h after enrichment (EE6hr). Wilcoxon rank–sum test, P = 1.4261 × 10⁻¹³. n = 401 cells from four mice. (D) Cells were ranked according to fosGFP intensity before enrichment (EE0hr). FosGFP intensity of each cell at EE0hr (black) and EE6hr (orange) was plotted against the rank order at EE0hr. (E) Fractions (mean ± SEM) of down, stable, and up cells during the 6-h window of enrichment. n = 4 mice.

