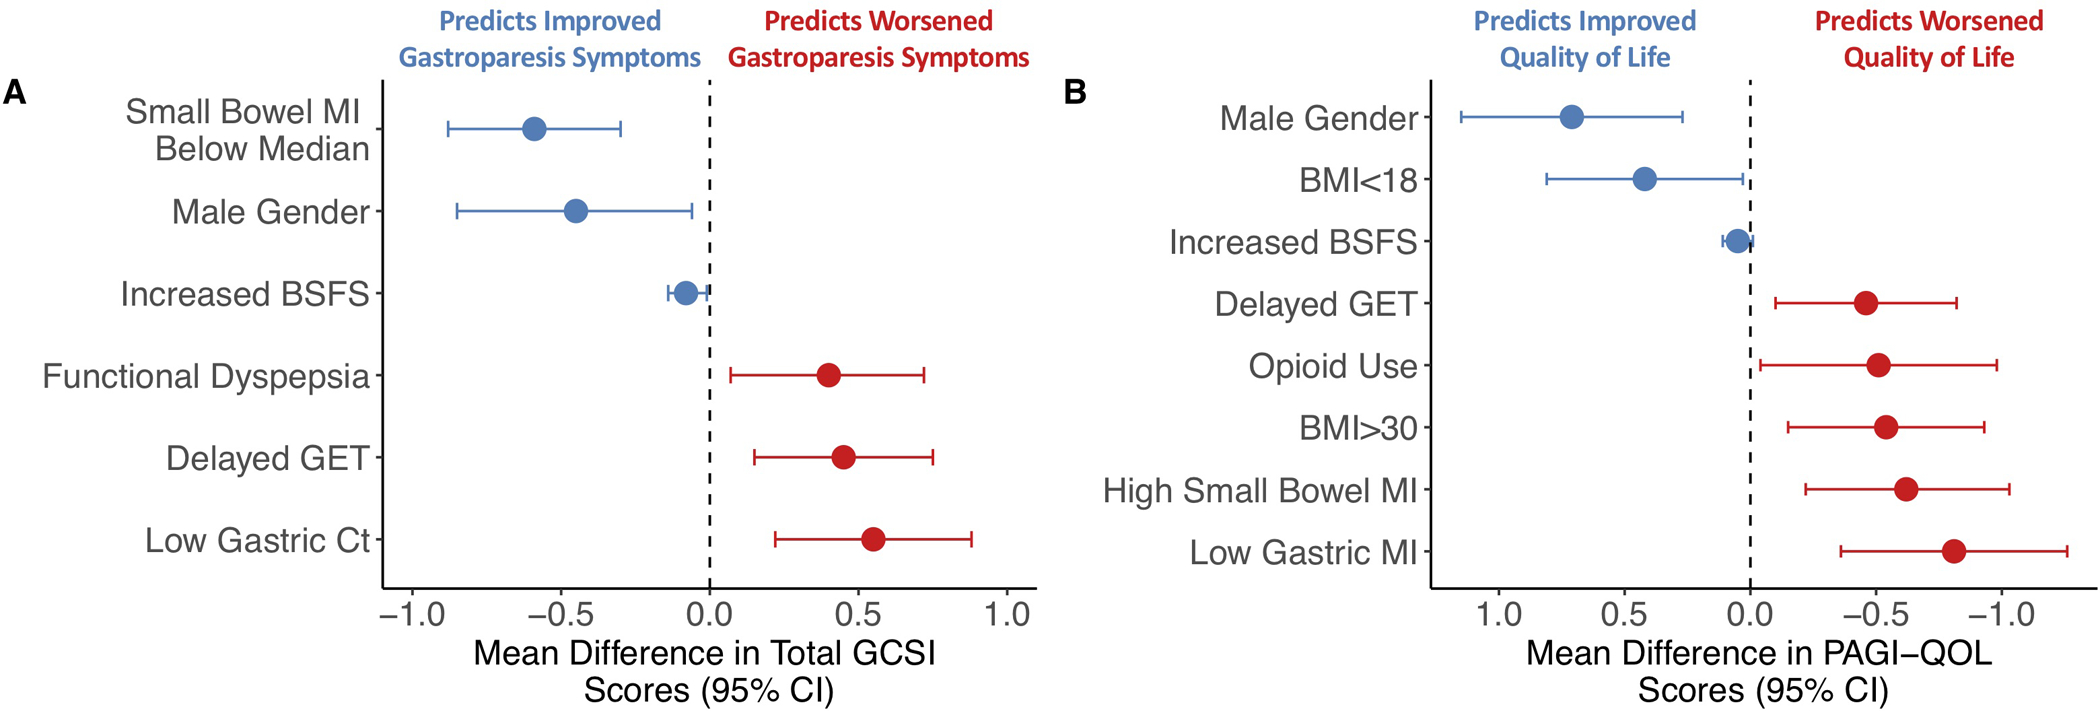
Figure 2. Predictors of overall upper GI symptom severity and quality of life scores by final multivariable models.

(A) Estimated mean change in overall GCSI scores with 95% confidence intervals (CI) based on final multivariable model. Negative values indicate factors predicting improvement (blue) while positive values indicate worsening (red) of overall GCSI scores. (B) Estimated mean differences (circles) in quality of life with accompanying 95% CIs based on final multivariable model. Positive values indicate factors predicting improvement (blue) while negative values indicate worsening (red) of PAGI-QOL scores.
