
Figure 5.
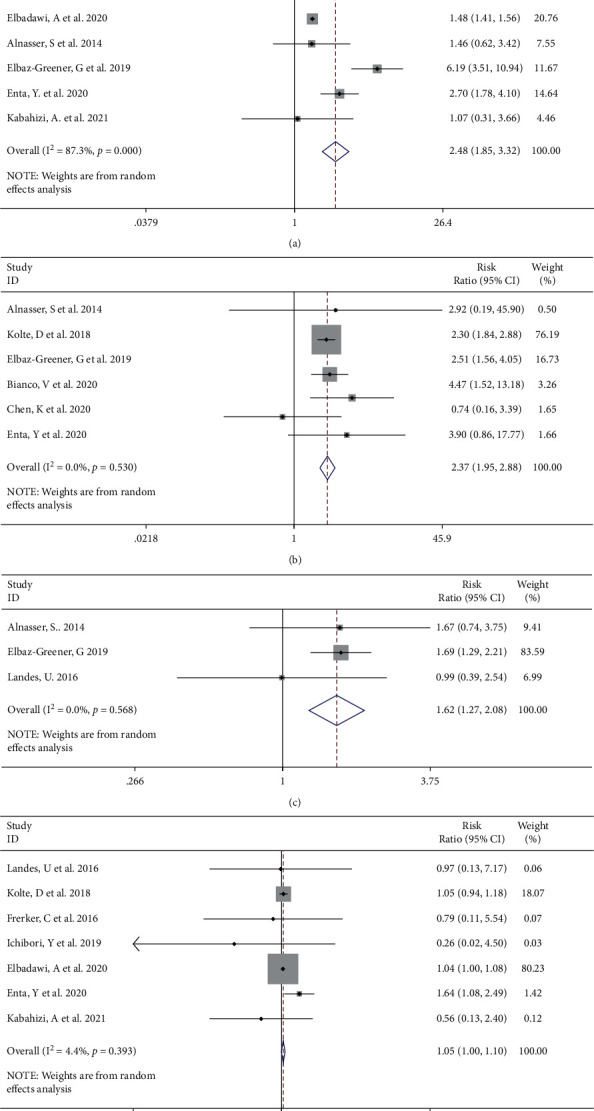
Forest plot showing the incidence of AKI (a), dialysis (b), bleeding (c), and major bleeding (d) increased in the emergent TAVI group. CI, confidence interval.
Official websites use .gov
A
.gov website belongs to an official
government organization in the United States.
Secure .gov websites use HTTPS
A lock (
) or https:// means you've safely
connected to the .gov website. Share sensitive
information only on official, secure websites.
Forest plot showing the incidence of AKI (a), dialysis (b), bleeding (c), and major bleeding (d) increased in the emergent TAVI group. CI, confidence interval.