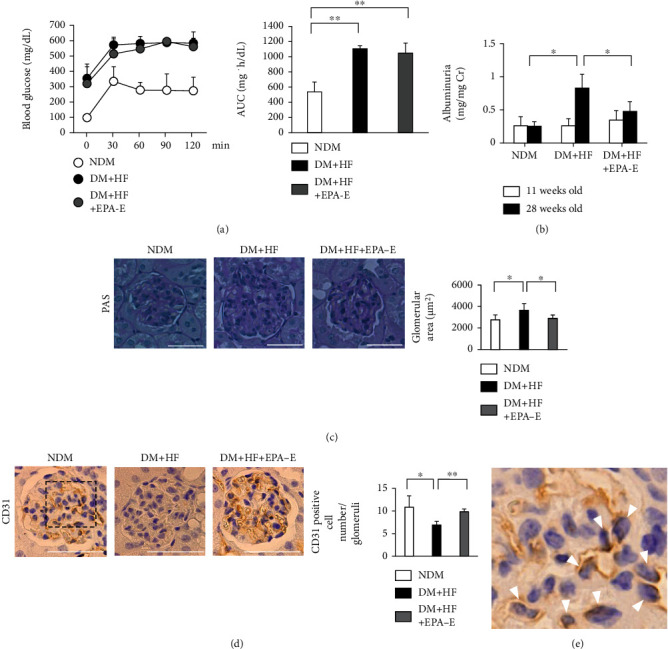
Figure 1.

Effects of EPA-E on blood glucose, albuminuria, renal morphology, and immunohistochemical staining of CD31 in the experimental groups. (a) Intraperitoneal glucose tolerance tests were performed in the experimental groups. Time-course measurements of blood glucose is shown. The area under the curve is derived from the intraperitoneal glucose tolerance tests. (b) Albuminuria was measured by the Albuwell. (c) Representative light microscopic appearance of glomeruli (periodic acid-Schiff) for experimental groups. Morphometric analysis of the glomerular surface area. Bar = 50 μm. (d) Representative immunohistochemistry of CD31 in the glomeruli. Sections were counterstained with hematoxylin solution. Bar = 50 μm. (e) Enlarged glomerular image of the box in d. Positive nuclear staining for CD31 was localized in endocapillary area (white triangle). ∗P < 0.05. ∗∗P < 0.01. These data are expressed as means ± SD. NDM: nondiabetic mice; DM + HF: mice with STZ-induced diabetes were fed a high-fat diet; DM + HF + EPA − E: STZ-induced diabetic mice were fed a high-fat diet treated with EPA-E.
