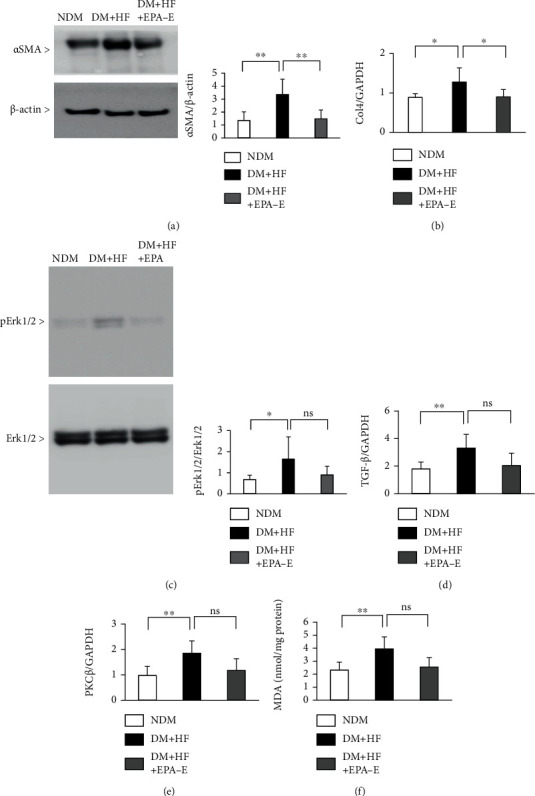
Figure 2.

Effect of EPA-E on TGF-β, PKCβ, and extracellular matrix in the experimental groups. (a) Immunoblot analysis of αSMA in the renal cortex of the nondiabetic mice, STZ-induced diabetic mice, and STZ-induced diabetic mice treated with EPA-E. (b) Type 4 collagen mRNA expression in the renal cortex of the experimental groups. (c) Immunoblot analysis of phosphor-Erk1/2 in the renal cortex of the experimental groups. (d) and (e) TGF-β (d) and PKCβ (e) mRNA expression in the renal cortex of the experimental groups. (f) Malondialdehyde is measured by the thiobarbituric acid reactive substance assay. ∗P < 0.05. ∗∗P < 0.01. ns: not significant. These data are expressed as means ± SD. NDM: nondiabetic mice; DM + HF: mice with STZ-induced diabetes were fed a high-fat diet; DM + HF + EPA − E: STZ-induced diabetic mice were fed a high-fat diet treated with EPA-E. Regarding immunoblot, membranes are cut prior to hybridization with antibodies, so these are not images of full-length blots.
