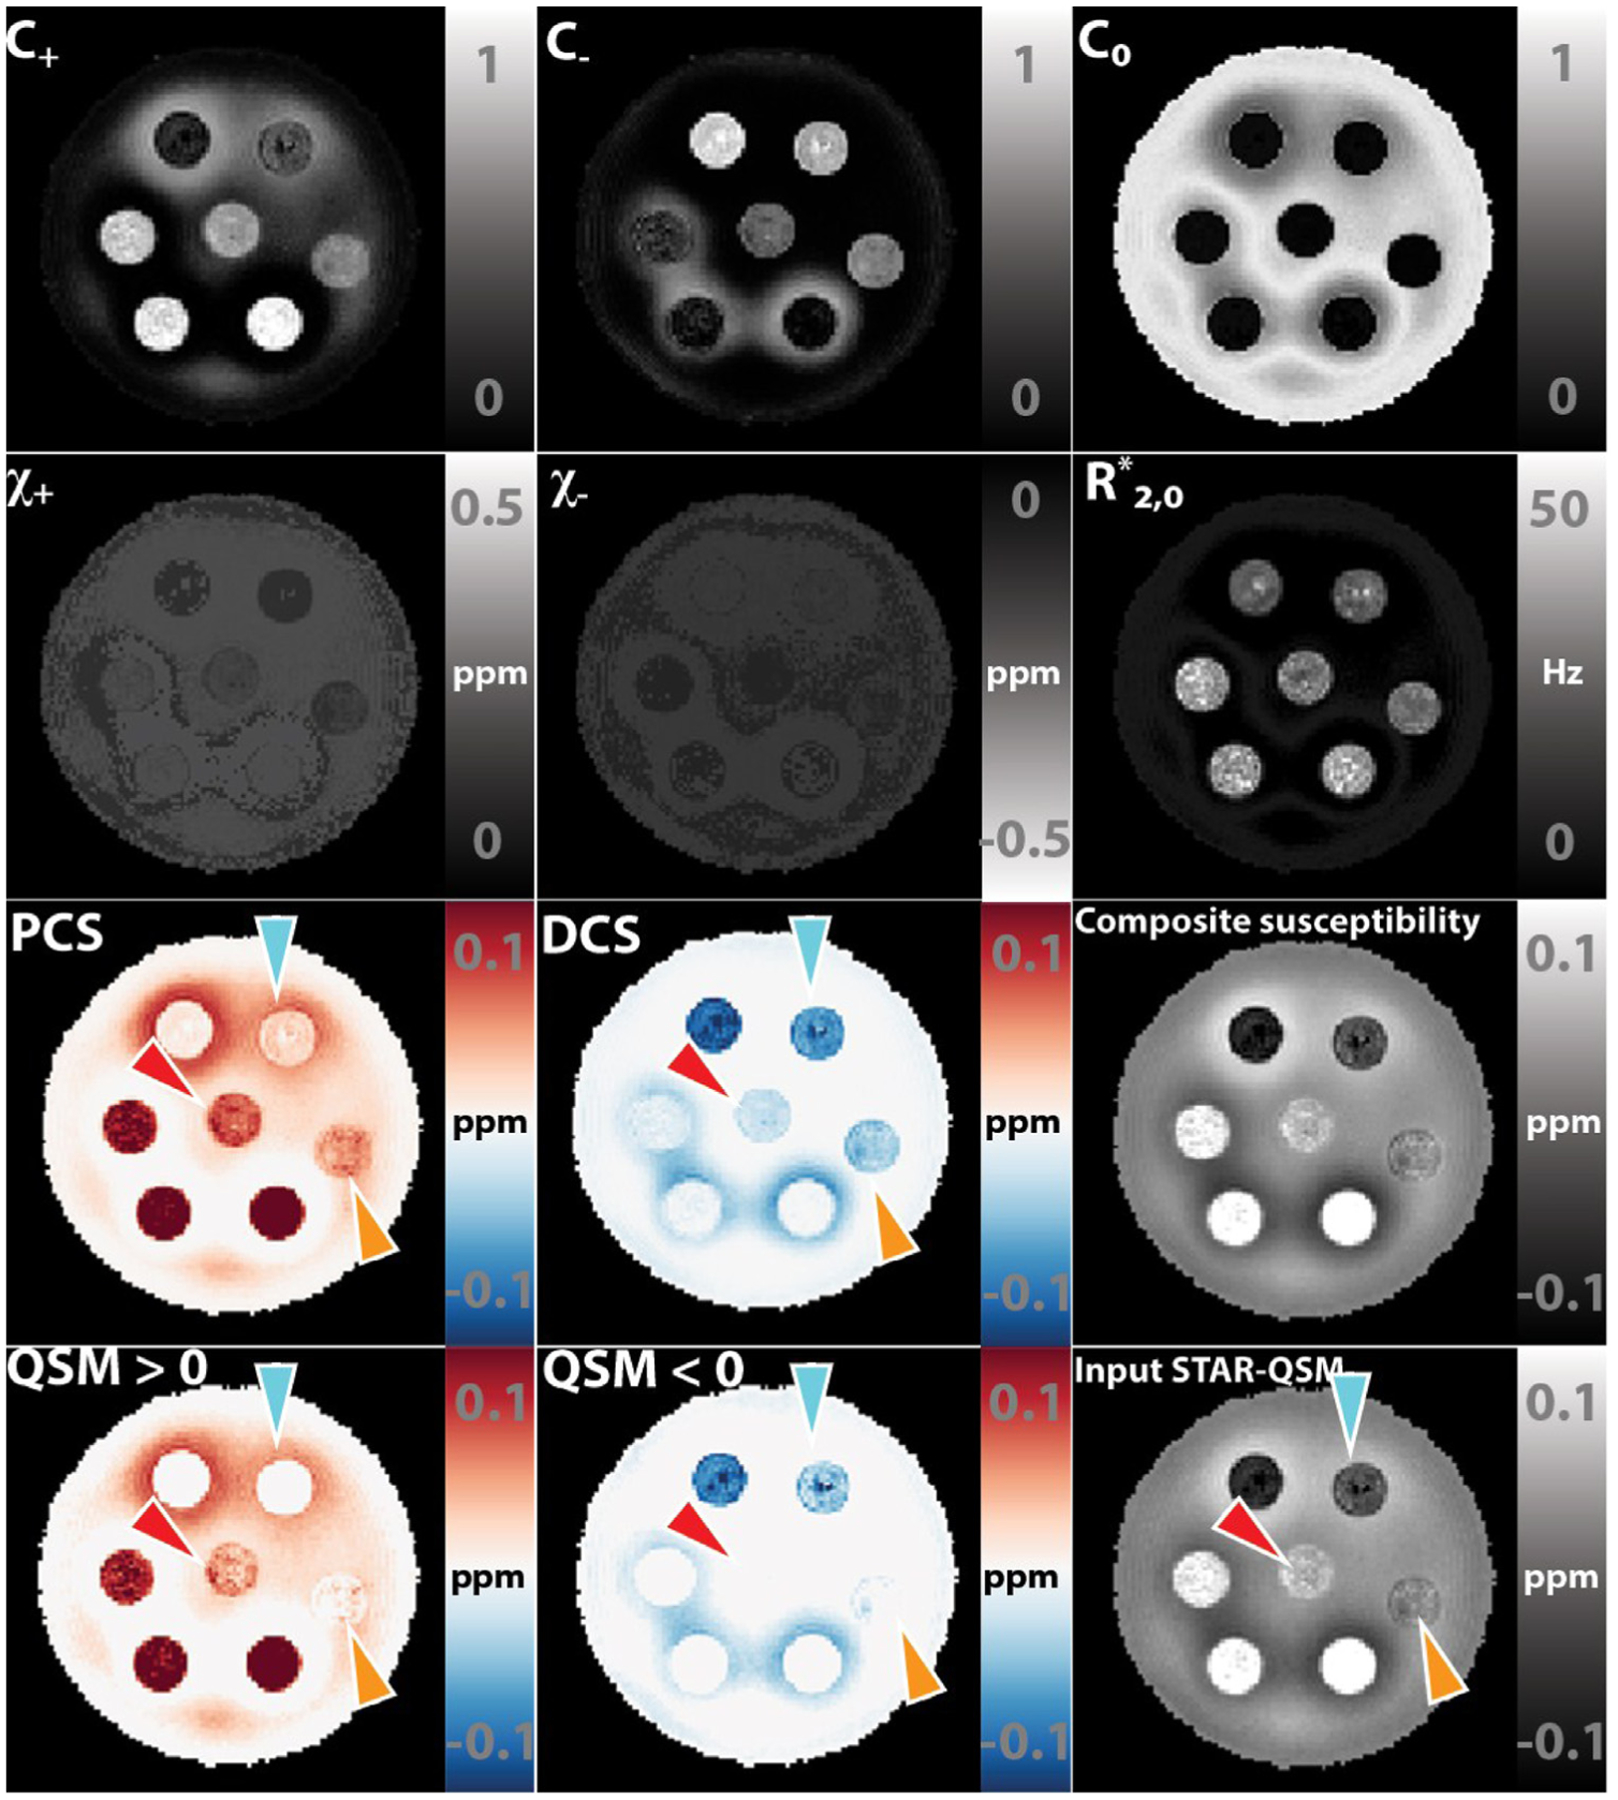
Fig. 3.

DECOMPOSE-QSM results of a susceptibility-mixture phantom showing the parameters and composite susceptibility maps in comparison with thresholding original QSM. Note that the subplots that relate to the diamagnetic component are displayed with inverted dynamic range to have a better visual contrast. The composition of each tube is shown in Fig. 4K. Arrows point at the regions of interest that show visually significant improvement in the contrast of the mixture.
