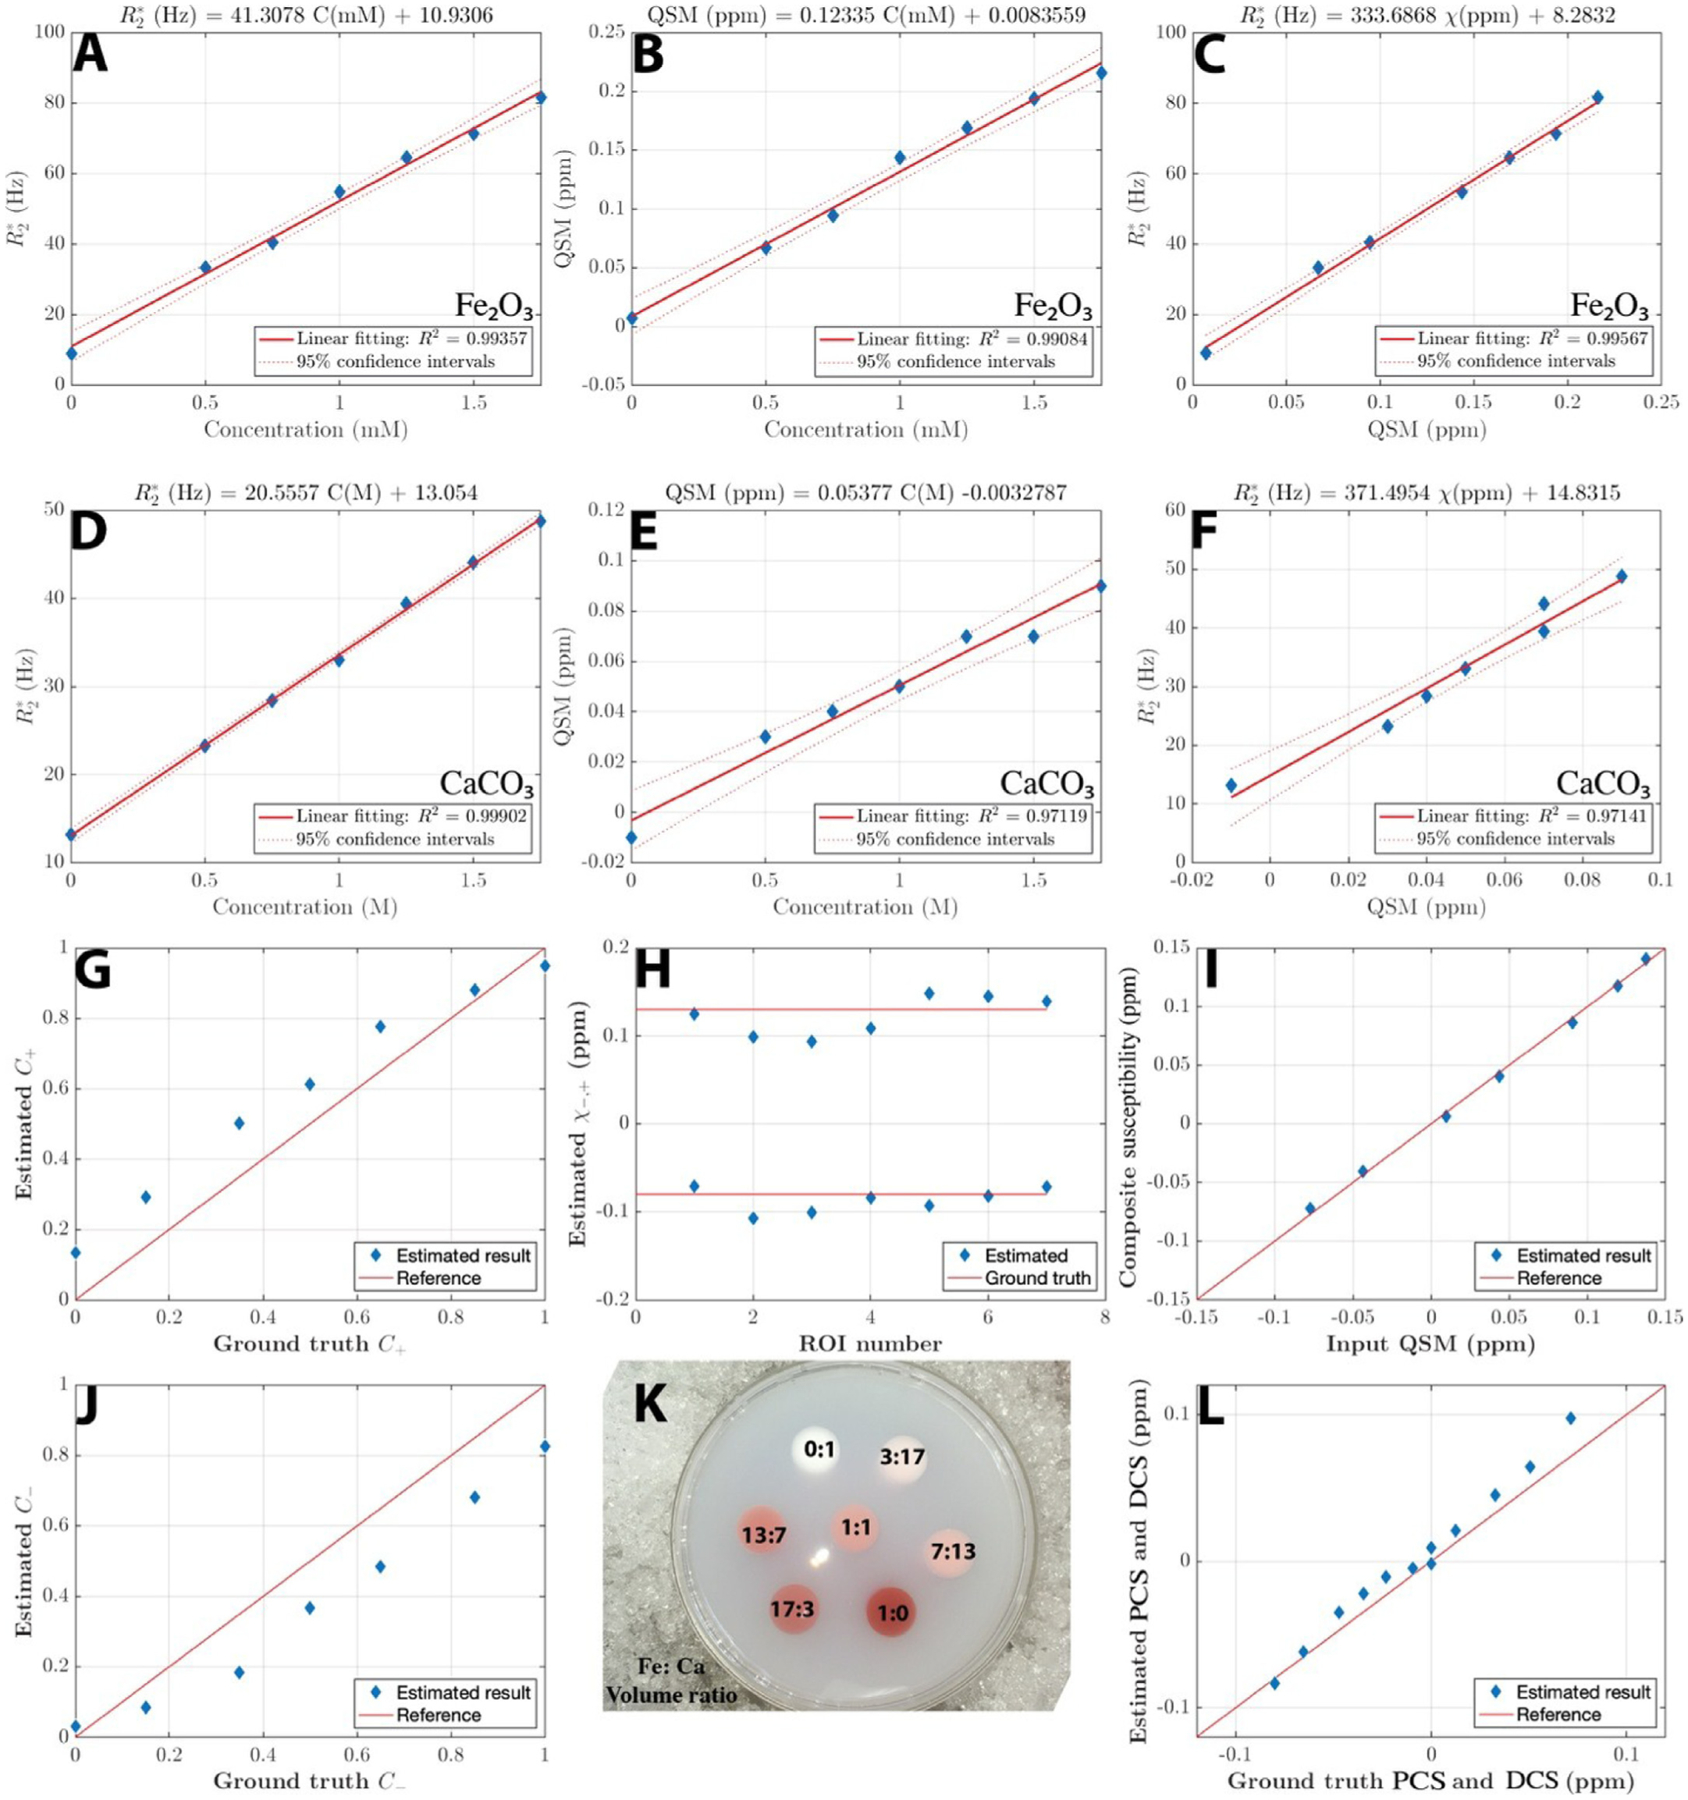
Fig. 4.

Phantom experiments. (A,B,D,E) Linear regression of and QSM versus concentrations of each species from each calibration phantom. (C~F) Linear regression of versus QSM for each calibration phantom. The linear slopes match the derivation from static regime theory.
(G~L) Parameters estimated with DECOMPOSE-QSM versus ground truths. Red solid lines are the reference lines when ground truth equals estimation. The composite susceptibility of each ROI in (I) agrees with input. PCS and DCS in (L) shows good alignment with ground truth. (K) is a top view photo of the susceptibility mixture phantom.
