
Fig. 5.
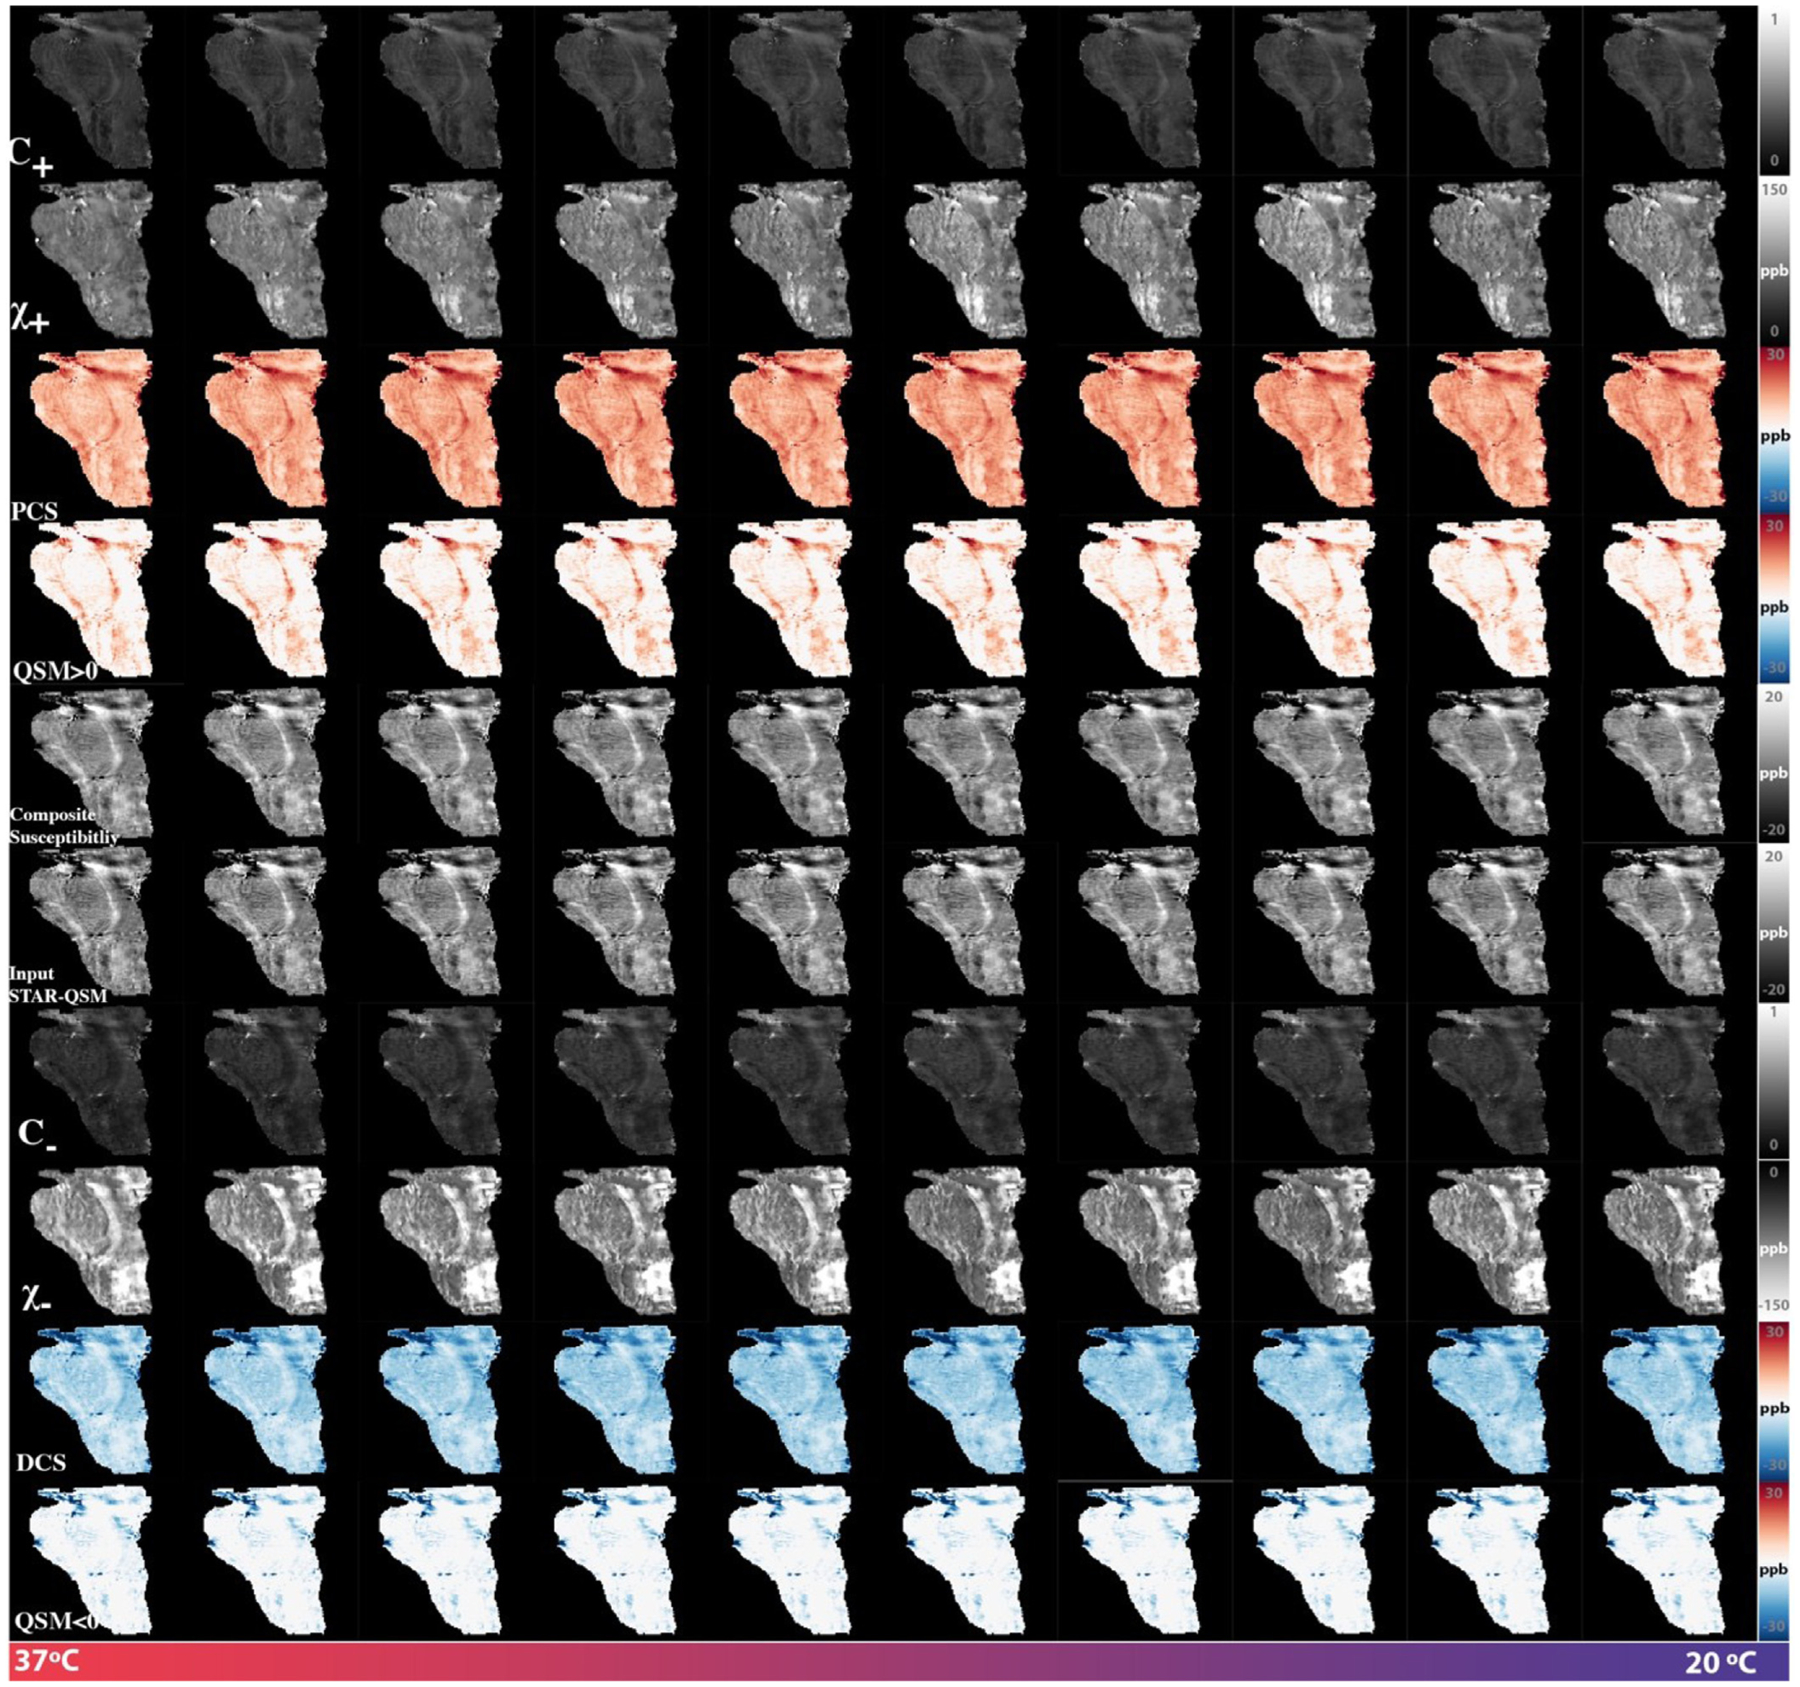
DECOMPOSE-QSM parameter maps of a brain stem specimen as a function of temperature. While DCS maps remain mostly stable, PCS maps show an increasing trend especially for the first five scans where temperature was changing the most drastically. The subplots relating to χ− and DCS are displayed with inverted dynamic range to have a better visual contrast.