
Fig. 7.
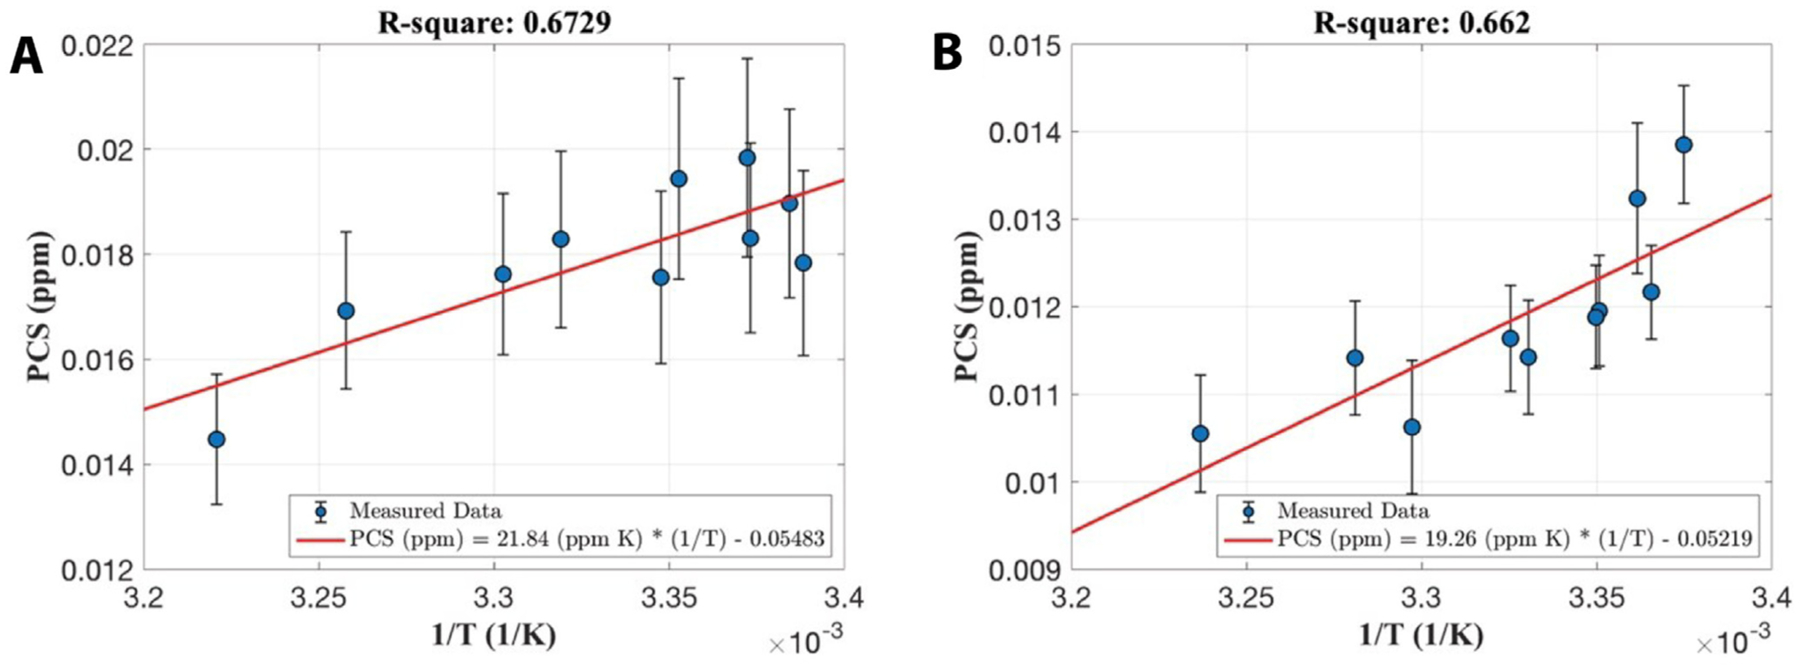
Linear correlations of paramagnetic component susceptibility with the inverse of temperature from data with five-echo data (A) and twelve echoes (B). Each error bar is the standard deviation of PCS of the same sagittal slice of each temperature acquisition.