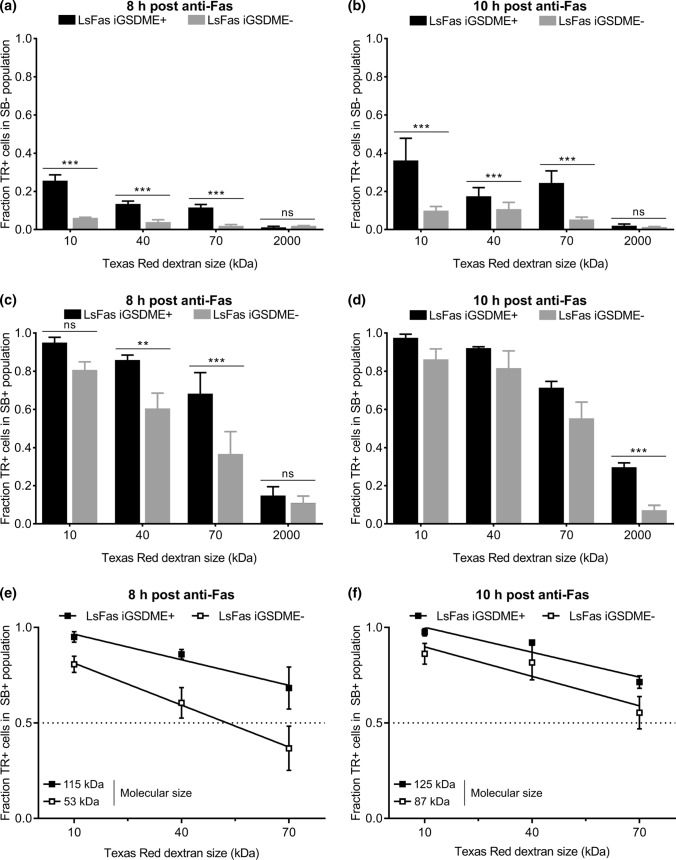
Fig. 3.
Influx of Texas Red-labeled dextrans of 10 kDa (TR10), 40 kDa (TR40), 70 kDa (TR70) and 2000 kDa (TR2000) in L929sAhFas iGSDME during apoptosis-driven secondary necrosis. a–f Flow cytometry analysis of Texas Red-labeled dextran uptake in L929sAhFas iGSDME cells with (L929sAhFas iGSDME+) and without (L929sAhFas iGSDME−) doxycycline-induced GSDME expression after 8 h and 10 h treatment with anti-Fas. a, b Fraction of the SB- population that is positive for various sizes of Texas Red-labeled dextrans. c, d Fraction of the SB+ population that is positive for various sizes of Texas Red-labeled dextrans. e, f Linear fit of data points for the fractions of the SB+ population positive for TR10, TR40 and TR70. Intersection of this line with the dotted line provides a rough estimation of molecular sizes that can enter 50% of the SB+ population. LsFas L929sAhFas; SB SYTOX Blue; TR Texas Red

