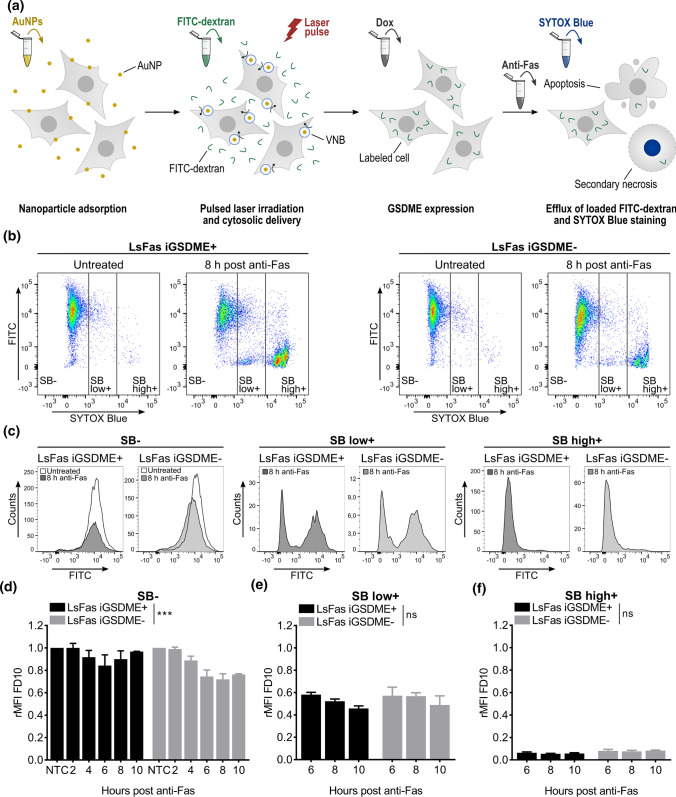
Fig. 4.
Efflux of FITC-labeled dextrans 10 kDa (FD10) from L929sAhFas iGSDME cells during apoptosis-driven secondary necrosis. a Principle of monitoring efflux of FITC-labeled dextrans after photoporation-based dextran loading. b–f Flow cytometry analysis of FD10 release in L929sAhFas iGSDME with (L929sAhFas iGSDME+) and without (L929sAhFas iGSDME−) doxycycline-induced GSDME expression when treated with anti-Fas. b Scatter plots of L929sAhFas iGSDME in presence (left) and absence (right) of GSDME expression untreated and after 8 h treatment with anti-Fas. c Histogram plots representing the distribution of the FD10 signal in the three zones of SB staining: SB− (left), SB low+ (middle) and SB high+ (right). d Graph representing the relative mean fluorescence intensity (rMFI) of FD10 in the SB− population (relative to the untreated SB− population) as a function of anti-Fas treatment. e Graph representing the relative mean fluorescence intensity (rMFI) of FD10 in the SB low+ population (relative to the untreated SB− population) as a function of anti-Fas treatment. f Graph representing the relative mean fluorescence intensity (rMFI) of the SB high+ population (relative to the untreated SB− population) as a function of anti-Fas treatment. AuNP, gold nanoparticle; Dox doxycycline; FD FITC-dextran; GSDME gasdermin E; LsFas L929sAhFas; NTC non-treatment control; SB SYTOX Blue; VNB vapor nanobubble

