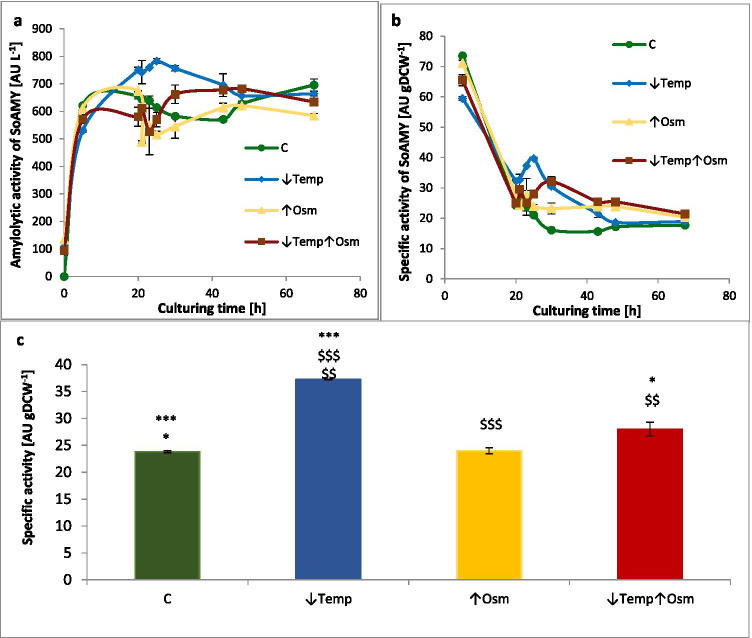
Fig. 3.
Amounts of extracellular activity of the rs-Prot (SoAMY) under different treatment variants and the control, given as: a) activity (titer) in [AU L−1] in time; b) specific activity normalized per biomass in [AU gDCW−1] in time; c) specific activity in [AU gDCW−1] at a time point of gene expression analysis and proteomics samples collection (23/25 h). Y axis: extracellular activity given in [AU L−1] or [AU gDCW−1]; X axis: a, b) time [h]; c) treatment variant. Color code is explained in the legend. Results indicate mean values from quadruplicate repetitions ± SD. In (c) *, $ indicate statistical significance with variant C (*), ↓Temp ($) at p value < 0.05, $$ at p value < 0.01, ***, $$$ at p value < 0.001

