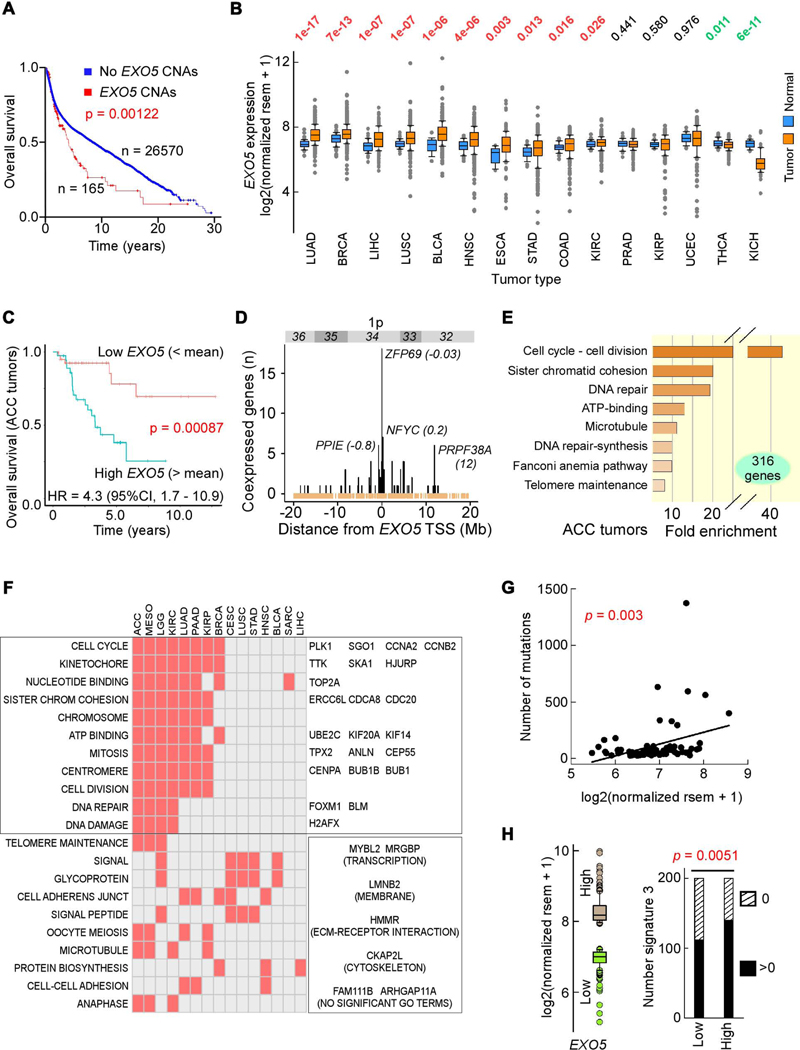
Figure 1. High EXO5 Gene Expression Predicts Poor Patient Survival and High Mutation Loads.
(A) Kaplan-Meier survival curve for patients with and without EXO5 copy number alterations (CNAs); median months survival: with CNAs 51.2, without CNAs 106.9. (B) Normalized EXO5 mRNA levels between tumor and matched normal tissues from TCGA. Top, p-values from Wilcoxon tests sorted by difference in mRNA level. (C) Kaplan-Meier survival probability curve and hazard ratio (HR) in ACC patients with low (below mean, orange) and high (above mean, blue) EXO5 mRNA levels. (D) Number of TCGA tumors with significant EXO5 coexpression with genes within cytogenetic band 1p32–1p36. In parenthesis, distance from EXO5 transcription start site (TSS) in Mbp. Brown, TSSs of refSeq genes. (E) GSEA for highly expressed genes in ACC. (F) Check plot of TCGA tumor types with significant GSEA enriched terms for all genes associated with poor outcome when expressed above mean levels. Left. GO terms; right, genes within (top) and outside (bottom) GO terms enriched in at least 6 tumor types and consistently overexpressed in all 15 tumor types relative to matched controls (see panel B). (G) Correlation between EXO5 mRNA level and somatic mutations in ACC; x-axis, EXO5 mRNA levels, y-axis, number of exome-wide somatic single-base substitutions and small indels. r = 0.337, P(α)0.05 = 0.829. (H) BRCA signature 3 mutations. Left, box plot of EXO5 expression for 200 subjects with highest (brown) and lowest (green) RNA-seq values. Right, bar plot of number of subjects with (black) and without (hatched) signature 3 mutations for low and high EXO5 gene expression groups, respectively, from left panel. P-value from Fisher’s exact test. See Figure S1.

