FIGURE 4.

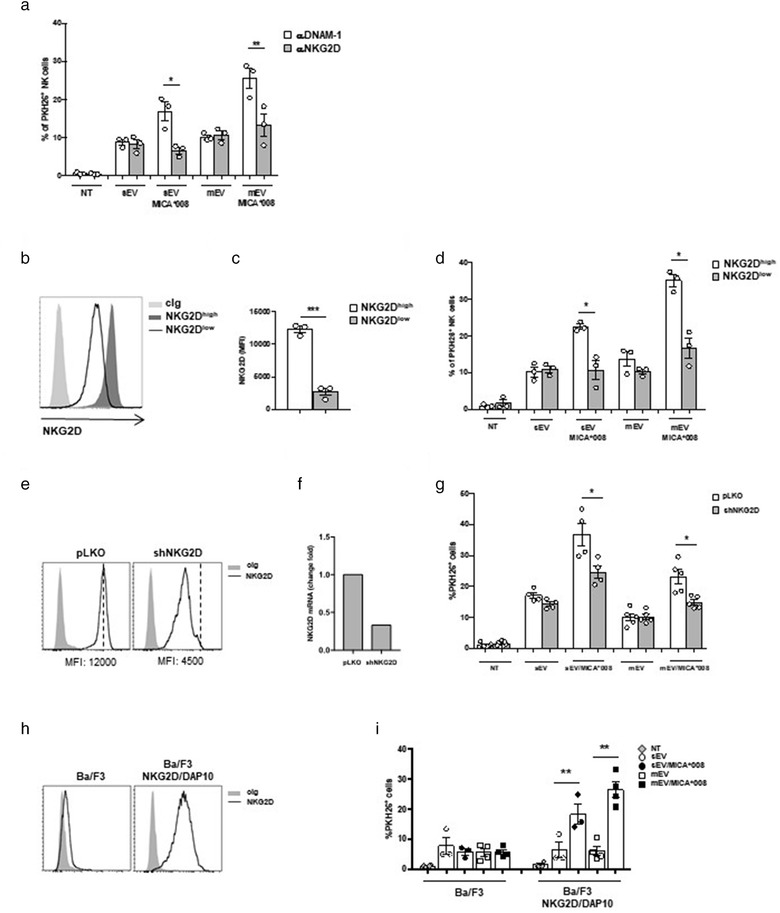
NKG2D mediates the uptake of MICA*008+ EVs. (a) NKL cells were pre‐treated with αNKG2D and αDNAM‐1 blocking mAbs and then incubated for 3 h with PKH26‐labelled sEVs (30 μg/ml) or mEVs (20 μg/ml). Data reported represent the mean of three independent experiments. Values represent the percentage of PKH26+ cells. (b and c) NKL cells were treated overnight with MICA*008+ EVs to induce NKG2D downmodulation (NKG2Dlow) or left untreated (NKG2Dhigh). (b) A representative experiment showing the different levels of NKG2D expression is shown. (c) The mean of three independent experiments is shown. (d) NKG2Dlow and NKG2Dhigh NKL cells were incubated with PKH26‐labelled EVs for 3 h as described in panel (a). Values represent the percentage of PKH26+ cells. The mean of three independent experiments is shown. (e–g) NKL cells were infected with the pLKO lentiviral vector containing a scrambled sequence or shRNA for silencing NKG2D. NKG2D expression was evaluated by (e) FACS analysis and (f) real‐time PCR. (g) NKL/pLKO and NKL/shNKG2D were incubated with PKH26‐labelled EVs for 3 h as described in panel (a). Values represent the percentage of PKH26+ cells. The mean of at least four independent experiments is shown. (h) Ba/F3 or Ba/F3 stably expressing the NKG2D/DAP10 complex were stained with cIg or anti‐NKG2D mAb and analyzed by Immunofluorescence and FACS analysis. (i) Ba/F3 or Ba/F3‐NKG2D/DAP10 were plated at 5 × 10⁵ cells/ml and incubated for 1 h with PKH26‐labelled mEVs as described in panel (a). Values represent the percentage of PKH26+ cells. The mean of three (for sEVs) or four (for mEVs) independent experiments is shown
