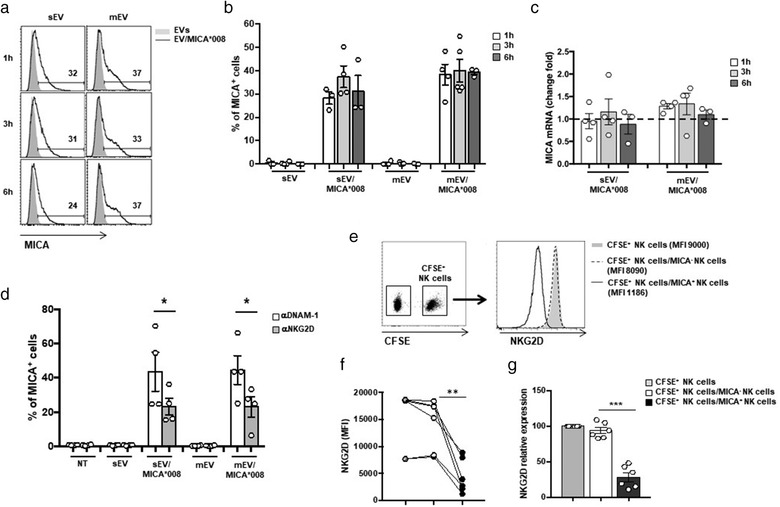
FIGURE 9.

MICA*008 is transferred by EVs on NK cells. (a and b) NKL cells were incubated for different times with 30 μg/ml of sEVs and 20 μg/ml of mEVs expressing or not MICA*008 and after that MICA expression was evaluated by immunofluorescence and FACS analysis. In (a) data relative to a representative experiment are shown. Numbers above histograms represent the percentage of MICA+ cells. In (b) the mean of different independent experiments is shown. (c) NKL cells were treated as described in panel (a) and (b). Cells were harvested at different times as indicated, and real‐time PCR of MICA mRNA was performed. Data, expressed as fold change, were normalized with β‐actin and referred to MICA*008– EVs treated cells considered as calibrator (dashed line). Values reported represent the mean of at least three independent experiments. (d) NKL cells were pre‐treated with anti‐NKG2D and anti‐DNAM‐1 blocking Abs and then incubated for 3 h with 30 μg/ml of sEVs and 20 μg/ml of mEVs expressing or not MICA*008. MICA expression on NKL cells was evaluated by immunofluorescence and FACS analysis. Data reported represent the mean of four independent experiments. (e–g) NKL cells were labelled with CFSE and then cocultured with NKL cells dressed with MICA for 18 h and NKG2D expression was evaluated on CFSE+ NKL cells. A representative experiment is shown in panel (e). In (f) NKG2D MFI values relative to six independent experiments are shown. In (g) data are expressed as relative expression of NKG2D (MFI) respect to the untreated group (CFSE+ NKL cells corresponded to 100%)
