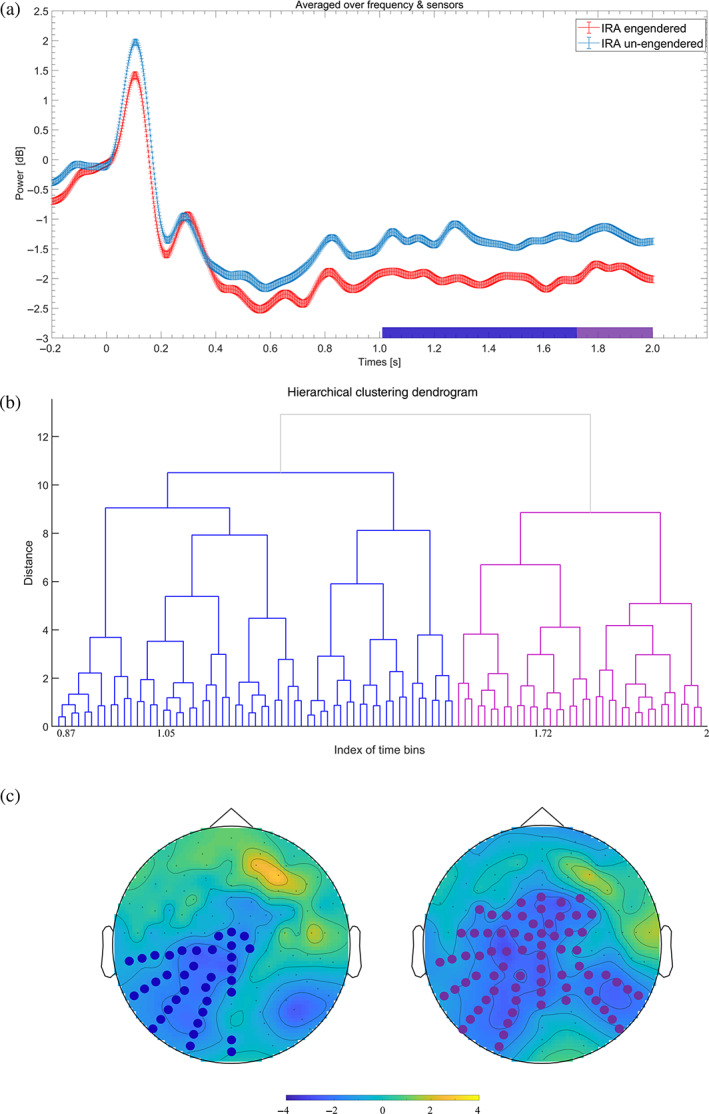
FIGURE 3.

Illustration of lower beta event‐related desynchronization (beta‐ERD). Individual preference faces that resulted in IRA elicited a stronger lower beta‐ERD than faces that did not result in IRA. (a) The time course of the lower beta‐ERD cluster. Values were averaged over the respective sensors (see (c)). (b) A dendrogram depicting hierarchical clustering. Each node represents a topography of t values at a significant time bin. (c) The topography of t values averaged across the significant time bins for each sub‐cluster (see (a,b))
