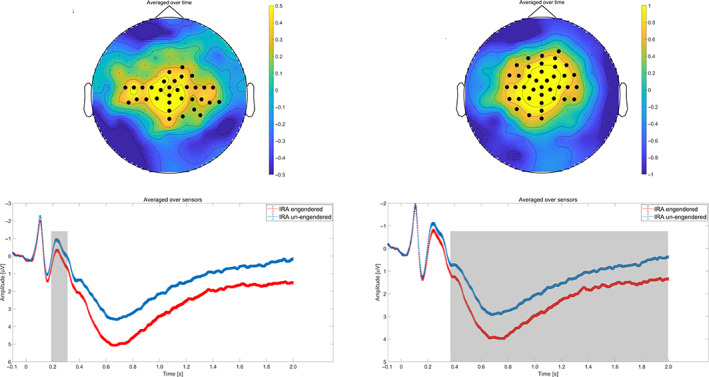
FIGURE 4.

Illustration of condition modulation for the ERP response. (a) Illustration of condition modulation for N200. The topography of t values (upper left). The time course of the N200 (bottom left). Gray shaded areas represent significant time interval. (b) Illustration of condition modulation for late positive potential (LPP). The topography of t values (upper right). The time course of the LPP (bottom right). Gray shaded areas represent the significant time intervals
