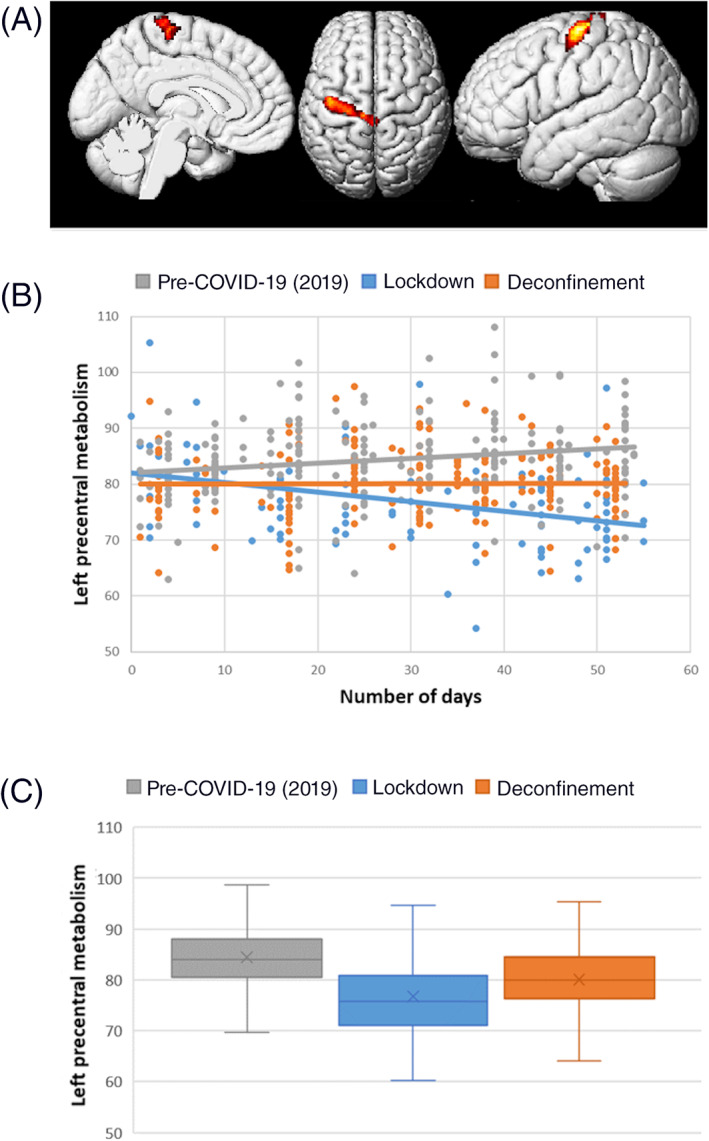
FIGURE 1.

Correlation between brain metabolism and lockdown duration in comparison to the pre‐COVID‐19 period (independently of age, sex, and the presence of focal morphological lesions). The lockdown duration is negatively correlated to the metabolism of the left precentral gyrus in comparison to the pre‐COVID‐19 period. The brain localization of this cluster is presented on a 3D‐MRI view on panel (a) (p cluster = .048 FWE‐corrected). Distribution of brain metabolic values of this cluster is presented among the three groups of patients according to the number of days on panel (b), confirming the negative correlation during the lockdown (r = −.35, p < .001; Pearson's test). On panel (c), the mean metabolic value of the left primary cortex is significantly improved during the deconfinement period in comparison to the lockdown period (p < .001, ANOVA post hoc test) but still significantly reduced during the deconfinement period in comparison to the pre‐COVID‐19 period in 2019 (p < .001, ANOVA post hoc test)
