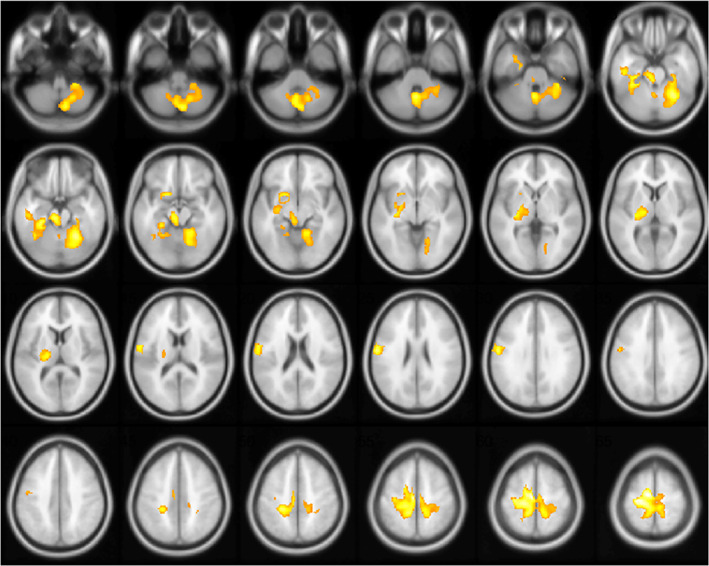
FIGURE 2.

Correlation between brain metabolism and lockdown duration using group × age interaction (independently of sex and presence of focal morphological lesions). The positive correlation with age is included as an explanatory variable in interaction with the two groups corresponding to the lockdown and control periods. The lockdown duration is negatively correlated to the metabolism of a large sensorimotor network prevailing in the dominant cerebrum, including the pre/postcentral cortex, thalamus, midbrain/pons, and contralateral cerebellum as well as the left amygdala, with major effect on younger patients (p cluster <.022 FWE‐corrected; the left hemisphere is on the left side)
