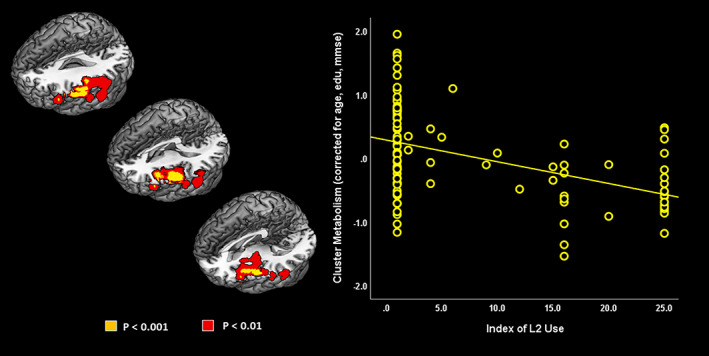
FIGURE 2.

Negative correlation between index of L2 use and FDG‐PET glucose metabolism across all patients (p < .001 uncorrected at voxel level, p < .05 at cluster level; Ke ≥100; yellow). Result at p < .01 uncorrected at voxel level are also shown (red). Images are displayed in neurological convention (the left side of the brain at left in the figure), with results overlaid on a high‐resolution MRI standard template
