FIGURE 3.

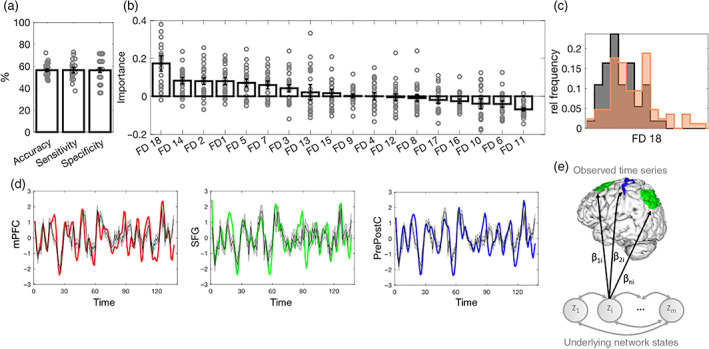
Classification of ALS versus HC based on resting state network dynamics (rsDyn). (a) Mean and standard error of the mean (SEM) of classification performance of the rsDyn classifier. (b) Mean and SEM of the feature importance of rsDyn features in classifying ALS diagnosis. (c) Significant group differences in the univariate analyses in feature FD18 at a Bonferroni corrected threshold (please see Table S4 for more details on rsDyn features). (d) Examples for true BOLD time series of the mPFC (red), the SFG (green), and the pre‐ and postcentral cortex (blue), and (generated) model predictions (gray with 90% confidence interval) of one individual. (e) Schematic illustration of FD18: according to the model (Equations (1) and (2)), the observed time series are regressed onto each underlying network state z i via regression coefficients (see Equation (2)). A low variance across columns of B thus indicates that each state z i is evenly represented across all observed time series. ALS, amyotrophic lateral sclerosis; FD, feature dynamics (see Section 2.3 for details); HC, healthy controls; mPFC, medial prefrontal cortex; rel, relative; SFG, superior frontal gyrus
