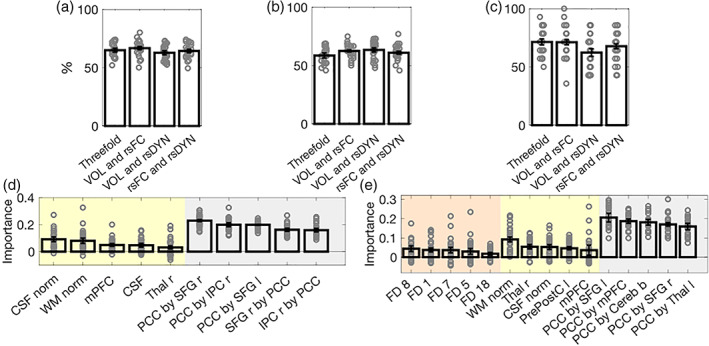
FIGURE 4.

Random forest multimodal classifiers. Mean and standard error of the mean (SEM) of the classification accuracy (a), sensitivity (b), and specificity (c) of multimodal classifiers (two, as well as three feature set combinations), respectively. The mean and SEM of the feature importance scores of the two classifier achieving the highest (i.e., bimodal: VOL and rsFC) and second highest (i.e., combination of three feature sets) performance are displayed in d and e, respectively. Yellow indicates VOL features, gray indicates rsFC features, and orange indicates rsDyn features (see Figure S2 for information on the feature importance scores of the remaining multimodal classifiers). b, bilateral; Cereb, cerebellum; CSF, cerebrospinal fluid; FD, feature dynamics; l, left; IPC, inferior parietal cortex; mPFC, medial prefrontal cortex; norm, normalized; PCC, posterior cingulate cortex; PrePostC, precentral/ postcentral cortex; r, right; rsDyn, resting state dynamics; rsFC, resting state functional connectivity; SFG, superior frontal gyrus; Thal, thalamus; VOL, brain volume; WM, white matter
