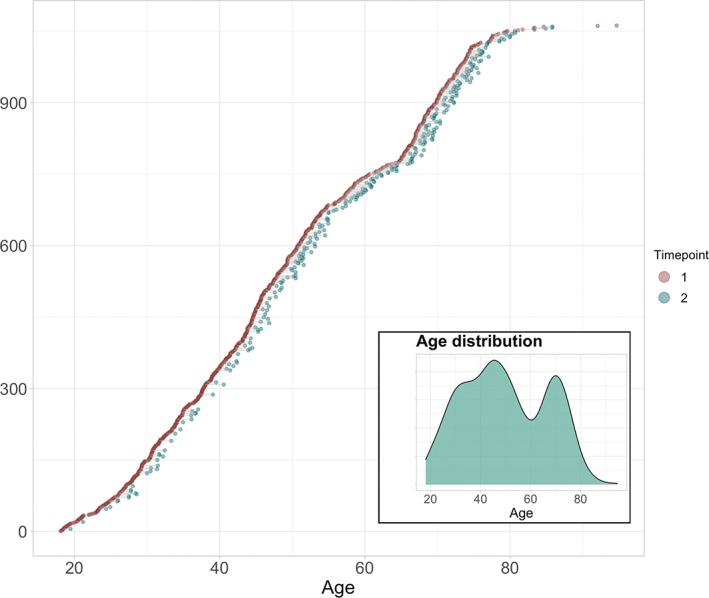
FIGURE 1.

Available baseline and follow‐up data. All participants are shown. Participants with data at baseline are visualized in red dots (N = 790). The subset (n = 272) with longitudinal measures are connected to corresponding timepoint with green dots. The mean interval between timepoints was 1.64 years (SD = 0.5 years). Subplot shows age distribution at baseline
