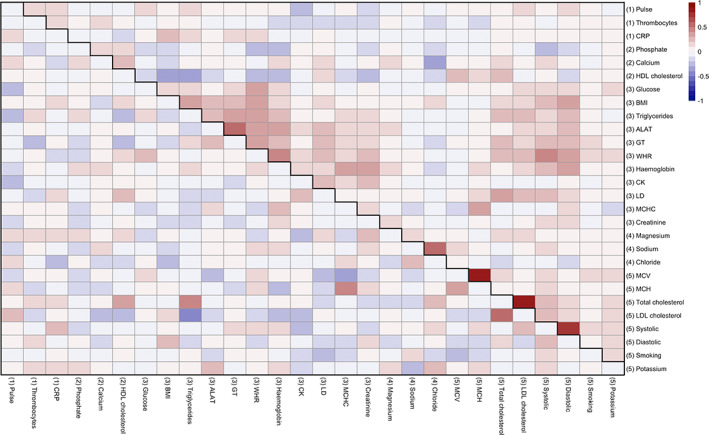
FIGURE 2.

Associations between CMRs. Heatmap showing correlation matrix of all CMRs (scaled), where the lower diagonal shows partial correlations (calculated by taking the residuals from two associated resistant regression models and calculating the correlations between them), and the upper diagonal shows full correlations. Hierarchical clustering of the variables was performed based on the full correlations and revealed five cluster groups, shown by numbers in brackets. Table S3 provides a detailed overview of all abbreviations used and Figure S9 an overview of the hierarchical clustering‐derived dendrogram used in the figure
