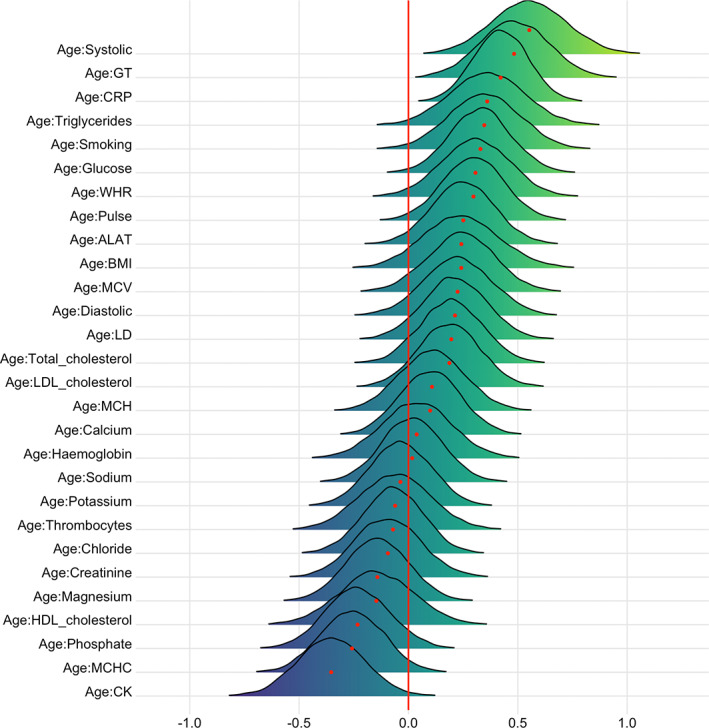
FIGURE 12.

Interaction effects between cardiometabolic risk factors and age on T1 BAG. The figure shows posterior distributions of the estimates for the interaction effect between age and each variable on T1 BAG, with red dot representing mean value. Width of the distribution represents the uncertainty of the parameter estimate
