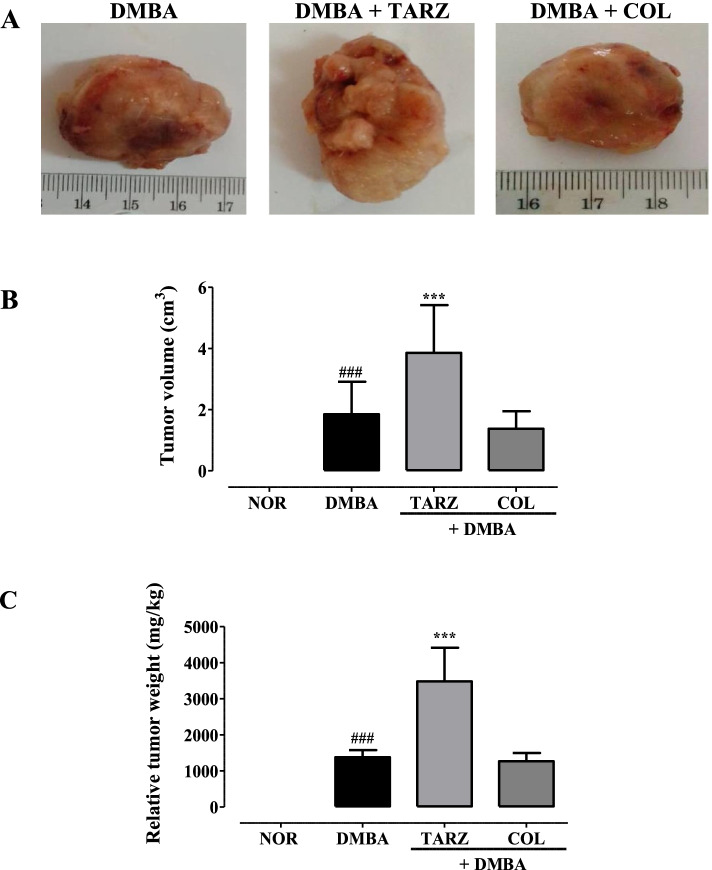
Fig. 2.
Effects of tartrazine on tumor morphology (A), tumor volume (B) and tumor weight (C). NOR = Animals serving as a normal control receiving distilled water; DMBA = Animals serving as negative control receiving distilled water; DMBA + TARZ = Animals receiving tartrazine at a dose of 50 mg/kg; DMBA + COL = Animals receiving a natural dye at a dose of 50 mg/kg. Dots represent means ± SEM (n = 8). All animals were exposed to a single dose of DMBA (50 mg/kg). ### p < 0.001 compared to the NOR group; *** p < 0.001 compared to the DMBA group

