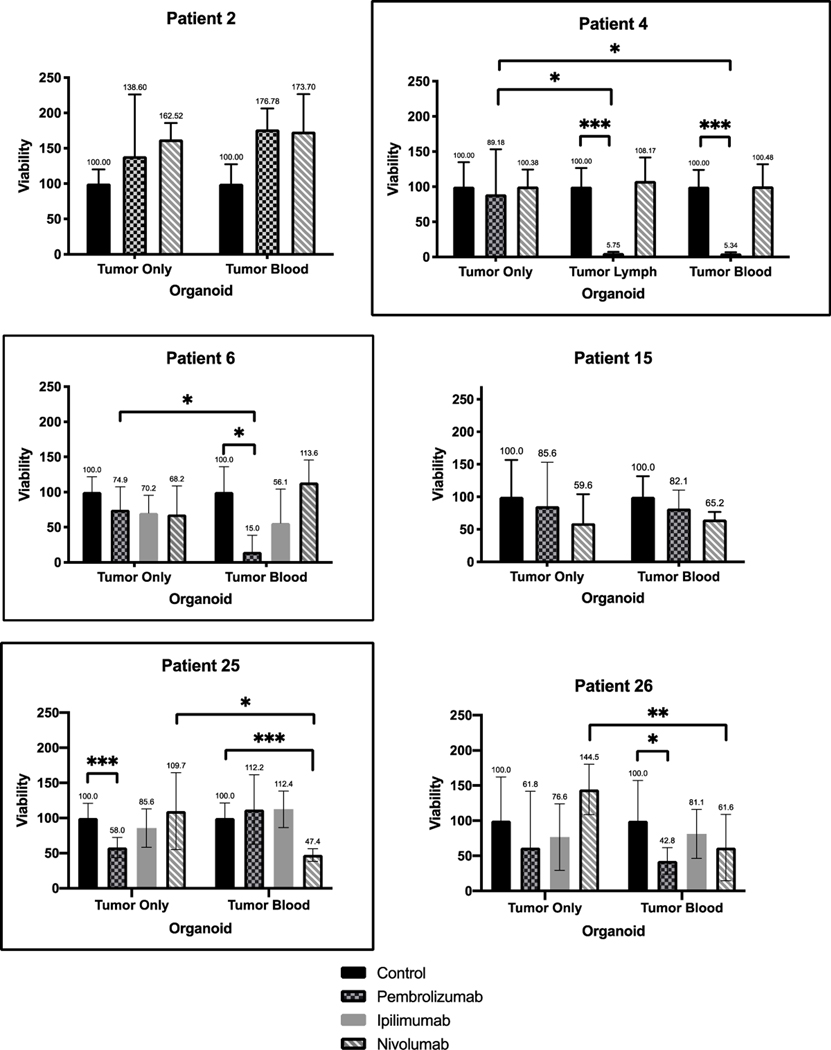
Fig 5A. Personalized Immunotherapy Response of High Grade Appendiceal Primaries iPTOs.
ATP viability histogram plots for HGA tumors exhibiting personalized treatment effect to CPIs. Y-axis represents viability, normalized to a scale of 100 for each control. X-axis represents the organoid condition—tumor only for non-immune enhanced PTOs, and tumor blood and/or tumor lymph for immune-enhanced organoids (iPTOs). Patients 4, 6 and 25 iPTOs were deemed to have a treatment response, outlined. One-way error bars represent standard deviation for each treatment condition, with the mean value above each error bar. * indicates p < 0.05. ** indicates p < 0.01. *** indicates p < 0.001.

