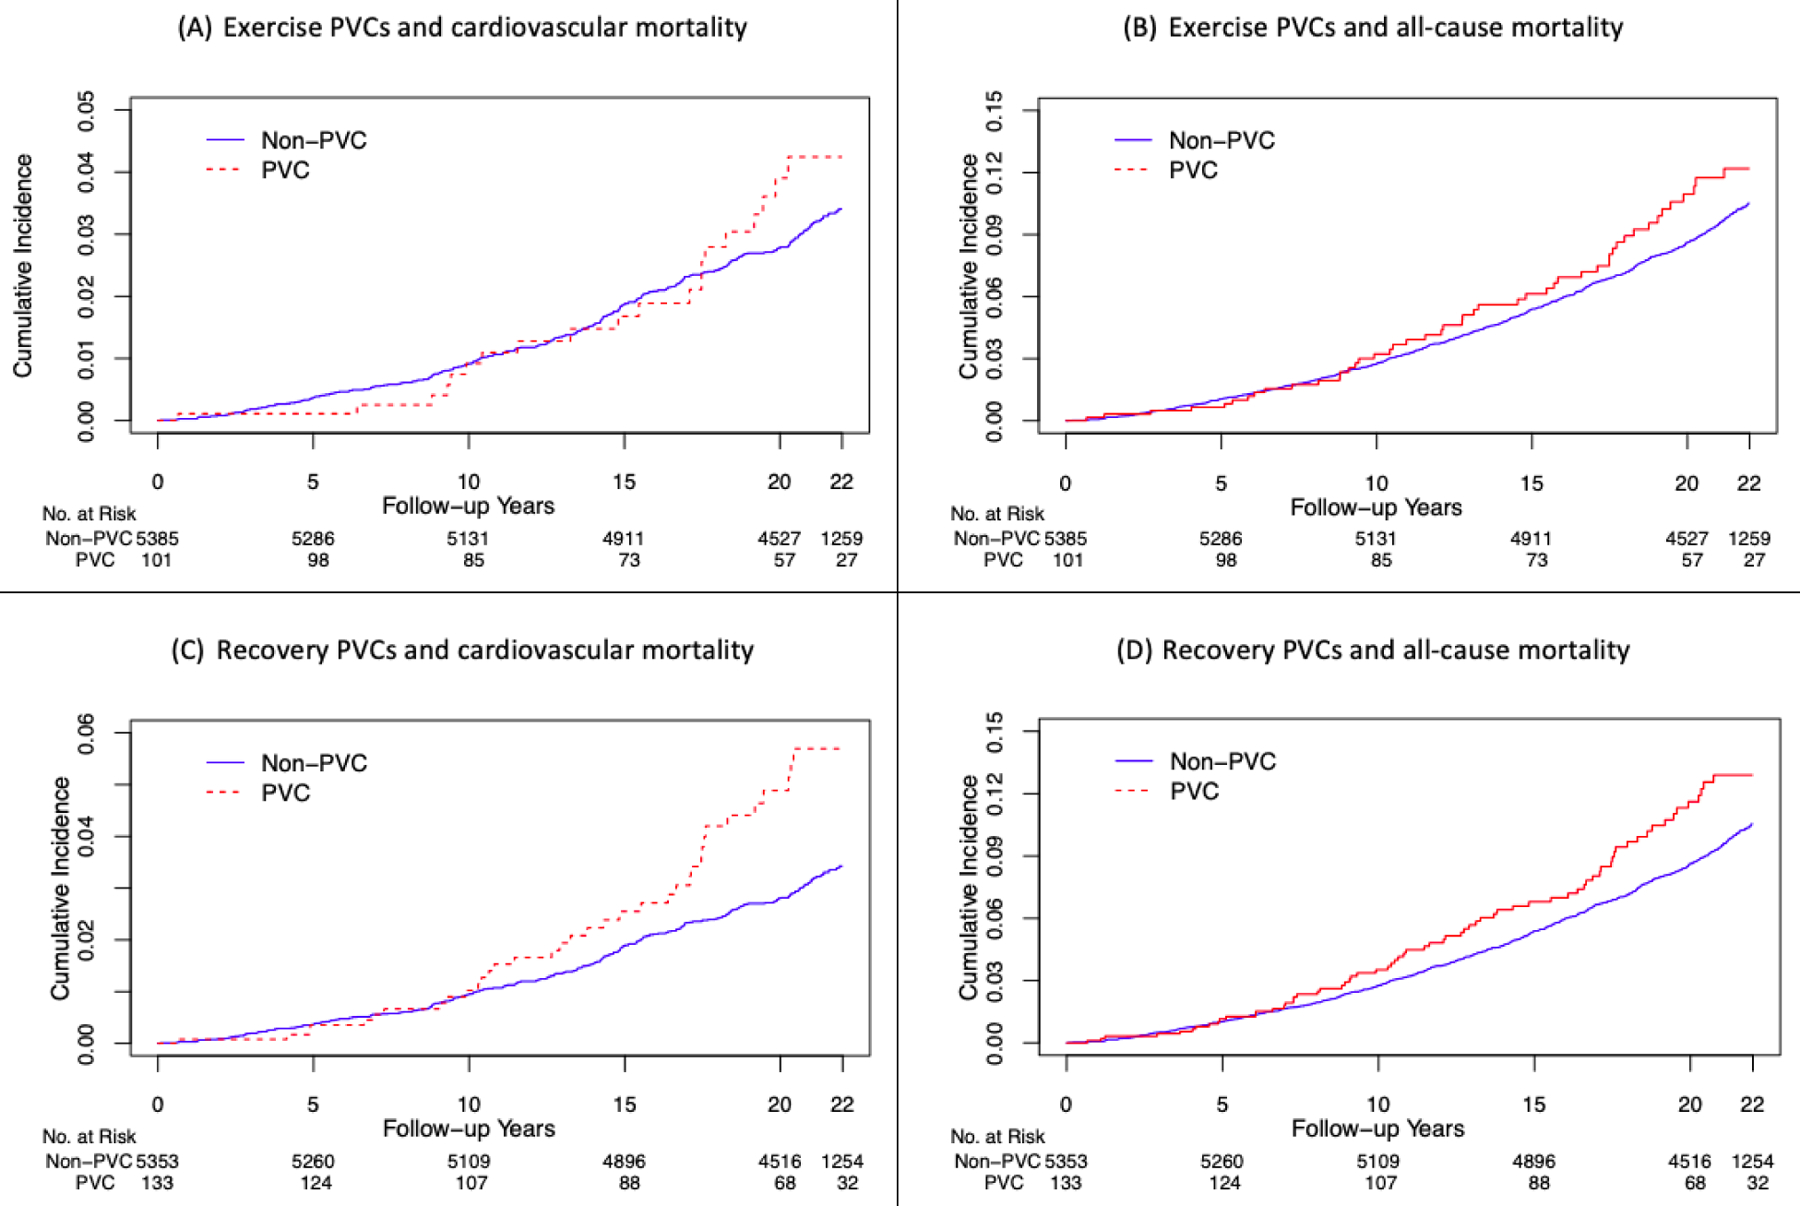
Figure 1. Cumulative probability curves of cardiovascular and all-cause mortality.

The shown curves are age- and sex-adjusted. Exercise-induced PVCs seem to confer a long-term (as opposed to short-term) mortality risk as shown by more pronounced red and blue curves separations as follow-up time increases. The curves seem to diverge somewhat more for high-grade PVCs during recovery rather than those during exercise, and more so for cardiovascular mortality rather than all-cause mortality.
PVC: Premature ventricular contraction
