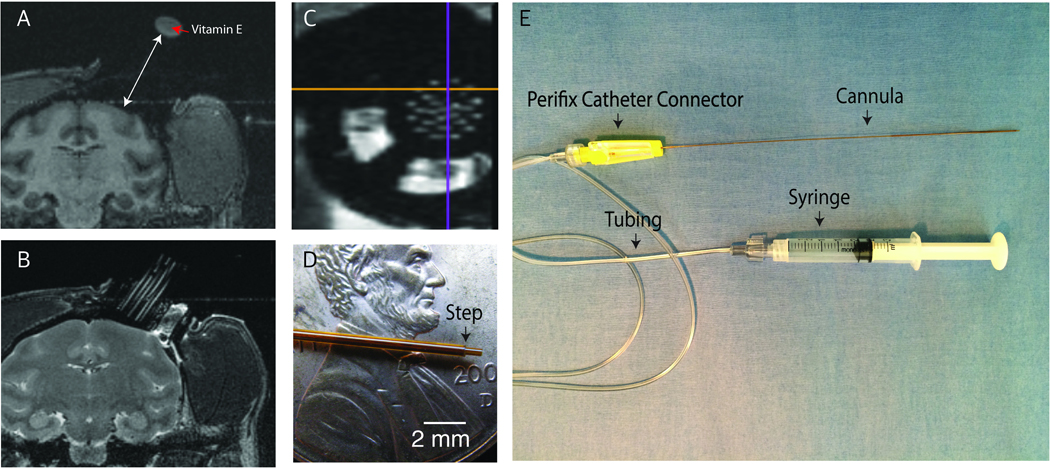
Figure 2.
A) T1-weighted image of vitamin E that was attached to the top of the injection grid that enables us to measure the distance to the surface of the brain (white arrow). B) T2-weighted image of the brain helps to plan the location of injection from the cannula grid filled with saline. C) MR image of the infusion chamber and the saline-filled cannula grid. The orthogonal lines represent the sagittal (yellow) and coronal (purple) planes. D) Photo of the reflux resistant injection cannula tip with the reflux resistant step (black arrow). E) Infusion lines. This figure has been modified from Yazdan-Shahmorad et al. 20169.

