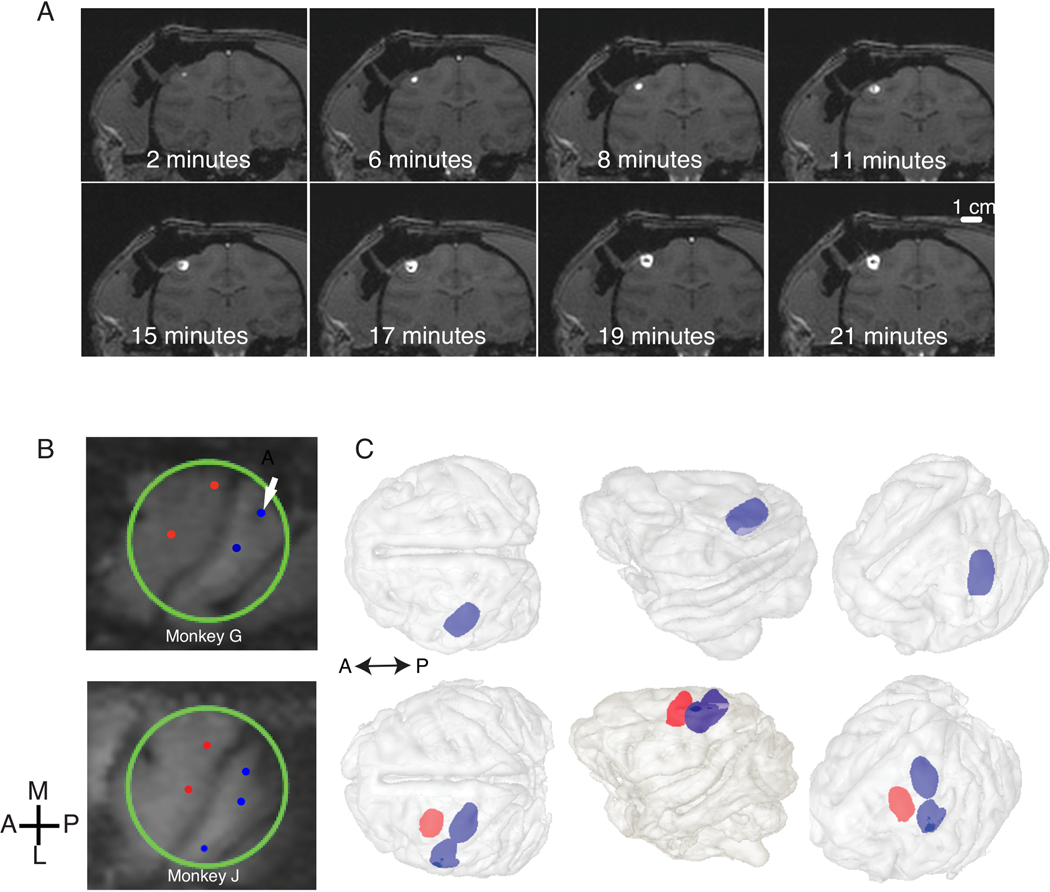
Figure 3.
A) Spread of 50 μL of the viral vector in coronal sections of Monkey G for one injection site in S1 (shown with an arrow in B). B) MRI surface rendering of the cortical surface below the cylinder for Monkeys G and J, respectively. The S1 infusion locations are shown in blue, M1 locations in red. C) MR Volume reconstruction of the spread of viral vector during CED infusion. Brain is shown in light gray; S1 and M1 infusion volumes are shown in blue and red, respectively. No MR volume reconstruction is available for the M1 infusions for monkey G since they were not done in the MR scanner. This figure has been modified from Yazdan-Shahmorad et al. 20169.

