Figure 2.

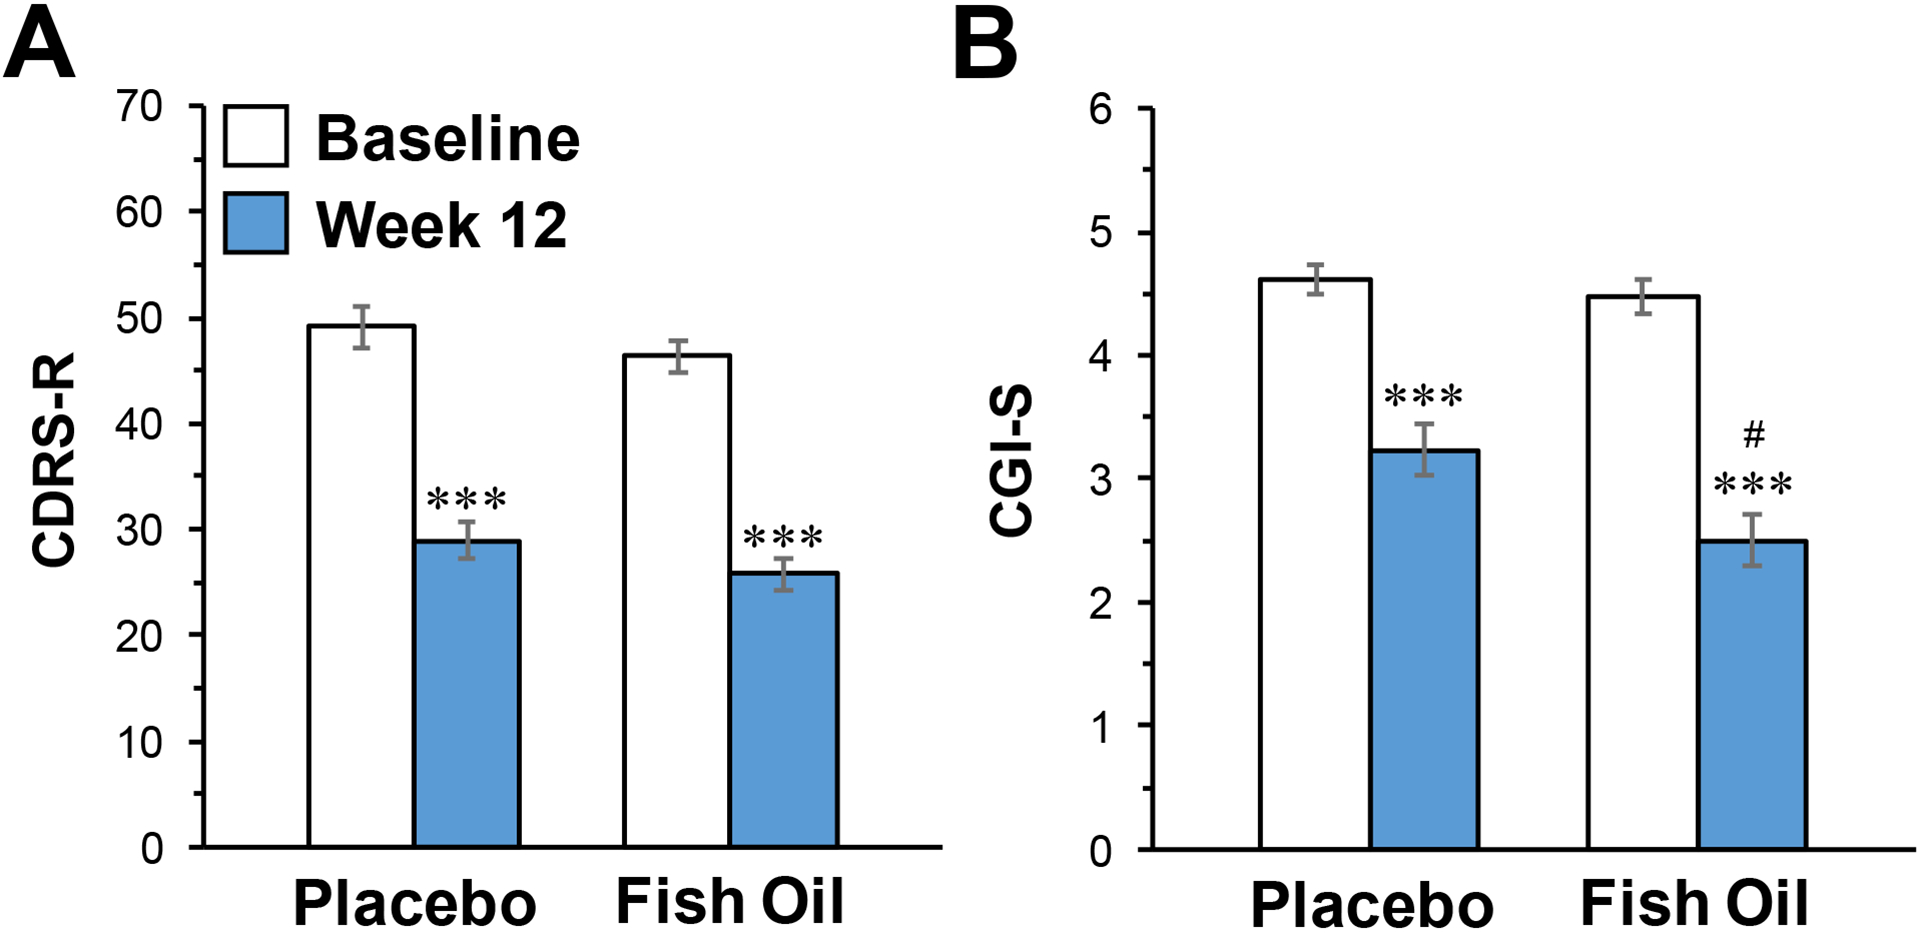
CDRS-R (A) and CGI-S (B) total scores at baseline and following 12-week supplementation with FO or placebo. Data are expressed as group mean ± S.E.M. ***P≤0.0001 vs. Baseline, #P≤0.01 vs. Placebo week 12.

CDRS-R (A) and CGI-S (B) total scores at baseline and following 12-week supplementation with FO or placebo. Data are expressed as group mean ± S.E.M. ***P≤0.0001 vs. Baseline, #P≤0.01 vs. Placebo week 12.