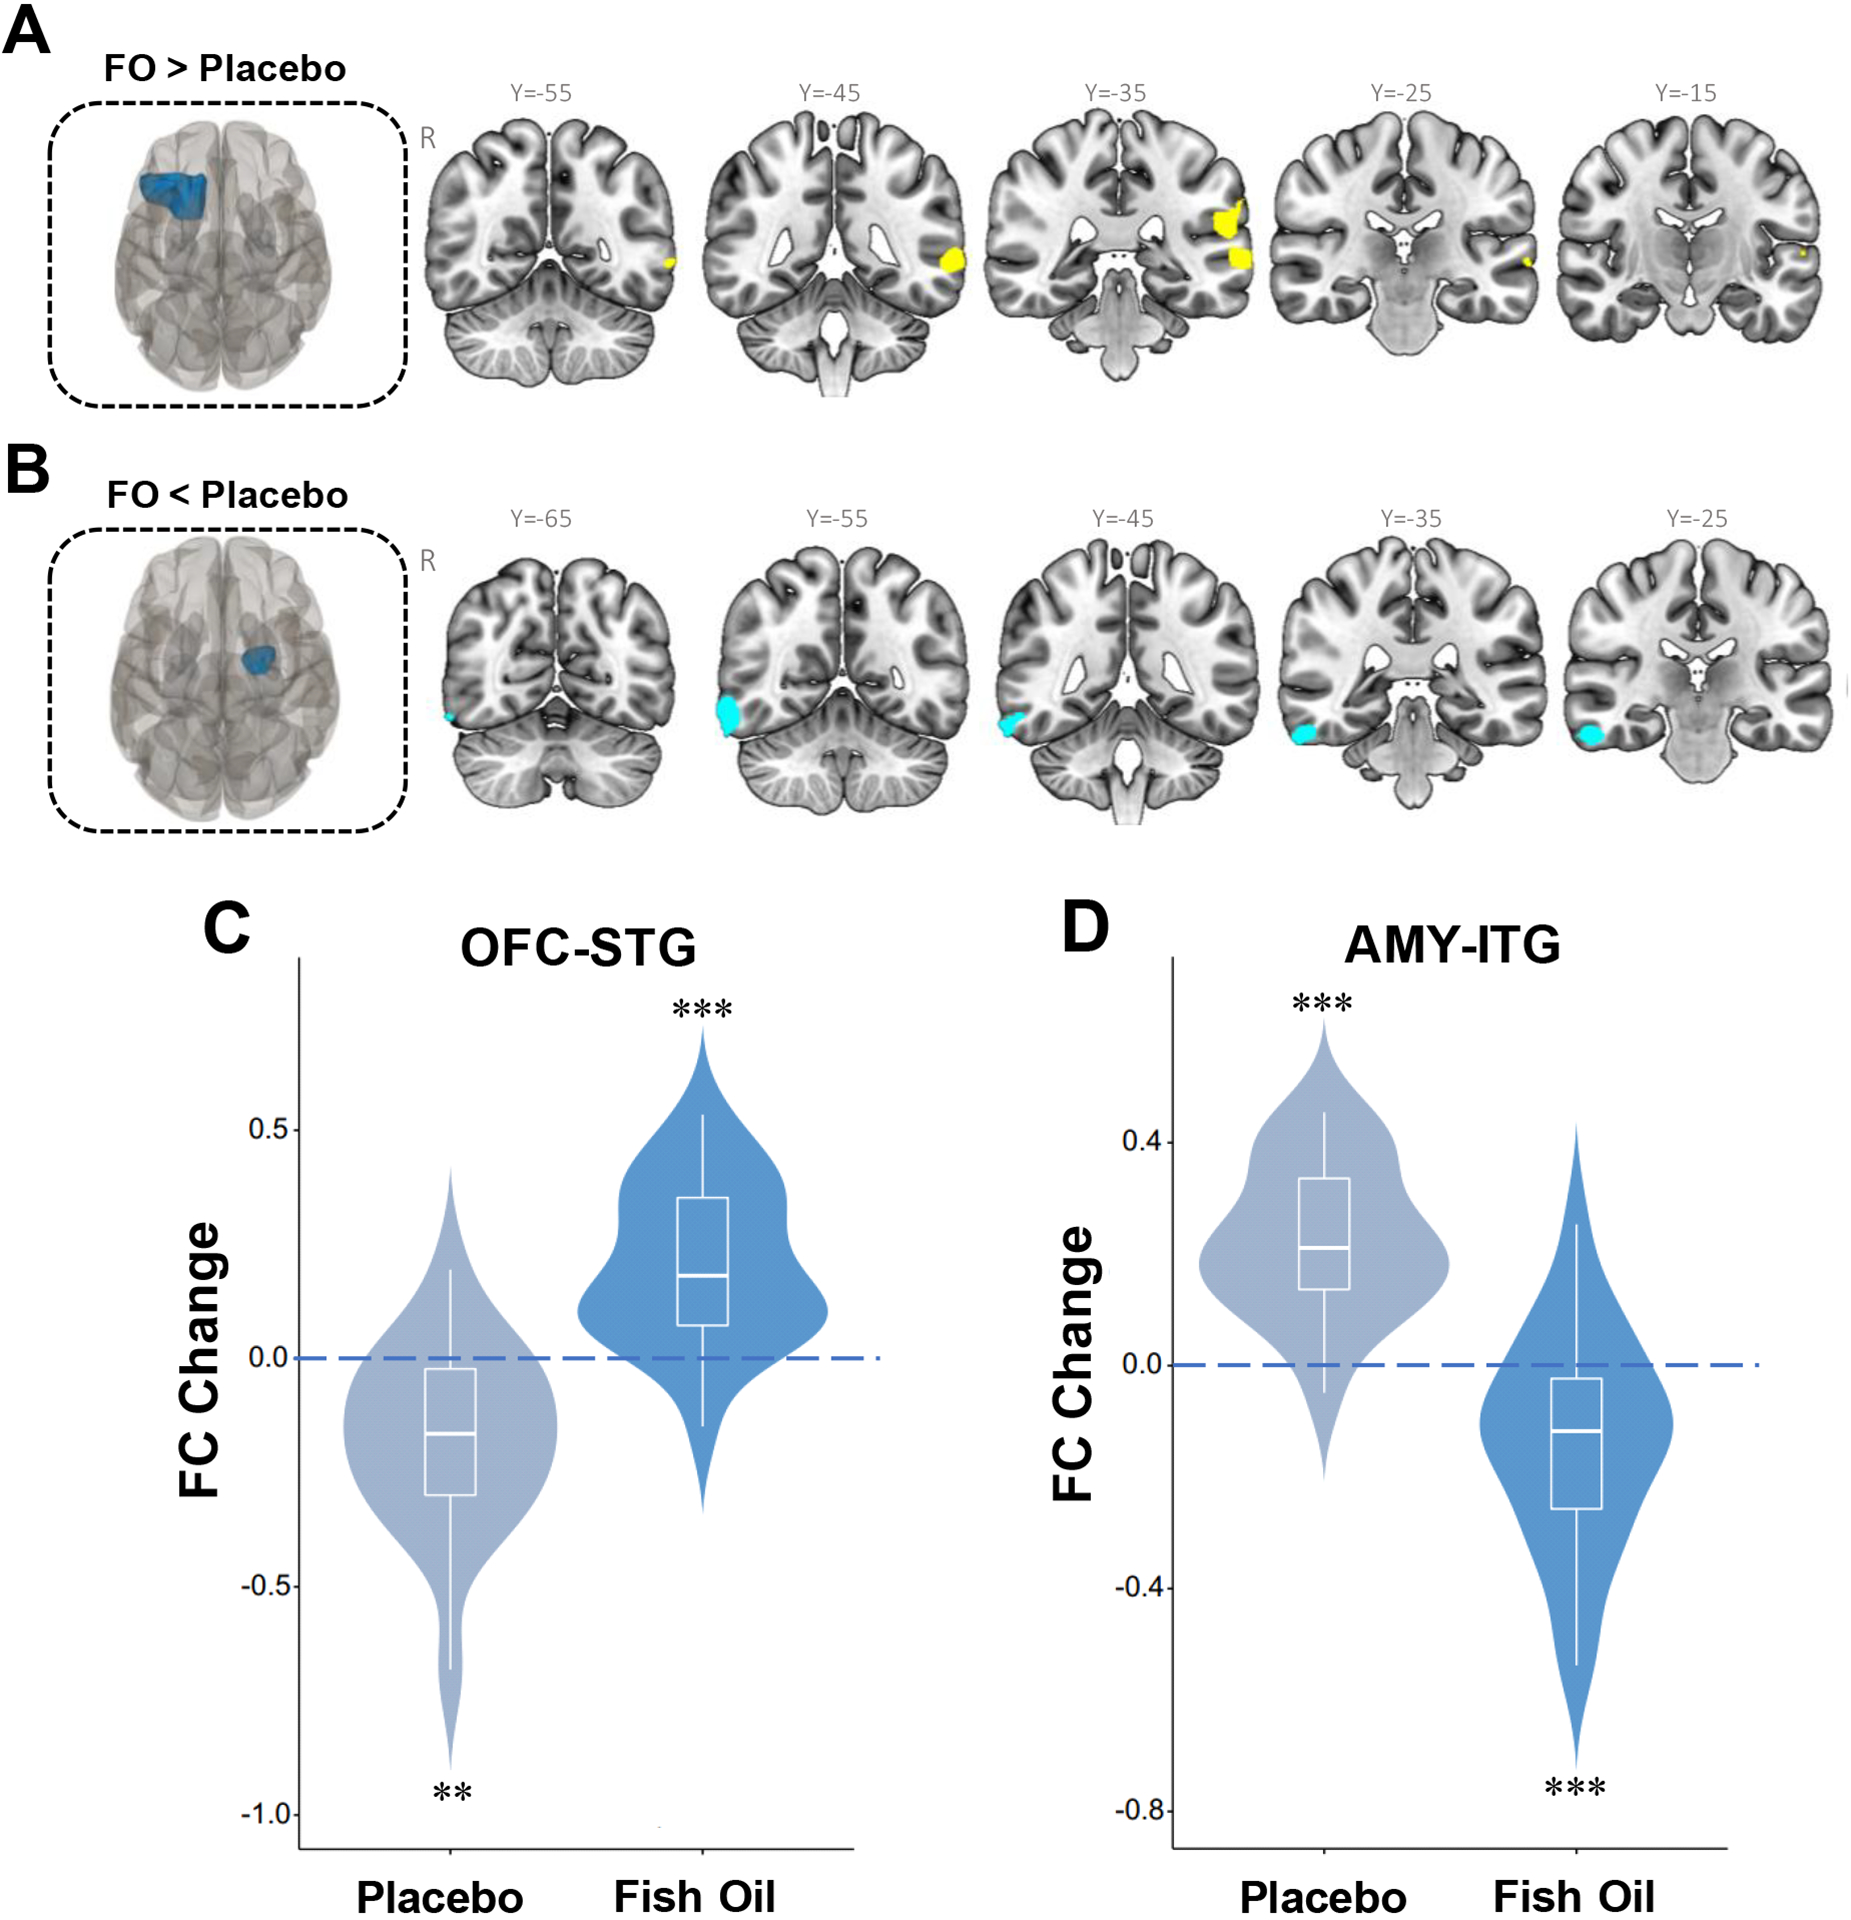
Figure 3.

Significant group by time interactions for change in functional connectivity between the left OFC (seed, red) and the left superior temporal gyrus (STG) (cluster size = 563 voxels, p<0.001, FWE corrected)(A), and between the right AMY (seed, red) and right inferior temporal gyrus (ITG) (cluster size = 573 voxels, p<0.001, FEW corrected)(B). Significant bidirectional baseline-endpoint changes in left OFC-STG (C) and right AMY-ITG (D) functional connectivity within both the placebo and FO groups. **P≤0.001, ***P≤0.0001 within group baseline vs. endpoint.
