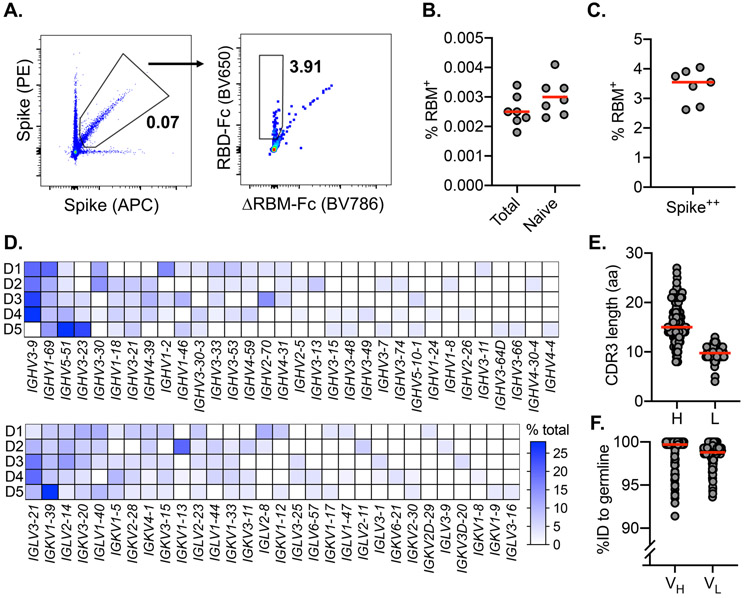
Fig. 1. SARS-CoV-2-specific naive B cells isolation and characterization.
(A) RBM-specific naive B cells from seronegative human donors were isolated by fluorescence-activated cell sorting gated on CD19+IgD+IgG−; representative plot from donor 6 is shown. ΔRBM is a sorting probe with N-linked glycans at residues 501 and 475. RBM-specific B cell frequency among (B) Total, naive, and (C) spike-positive cells from each donor (n = 7). Red bars indicate the mean percent values. (D) Heat map showing variable-gene usage for all paired B cell sequences. Scale indicates percent of total sequences for each donor (D1-D5). (E) Heavy (H) and light (L) CDR3 amino acid length distribution determined using IMGT numbering. Red bars indicate median amino acid length. (F) Divergence from inferred germline gene sequences. Red bars indicate the mean percent values.

