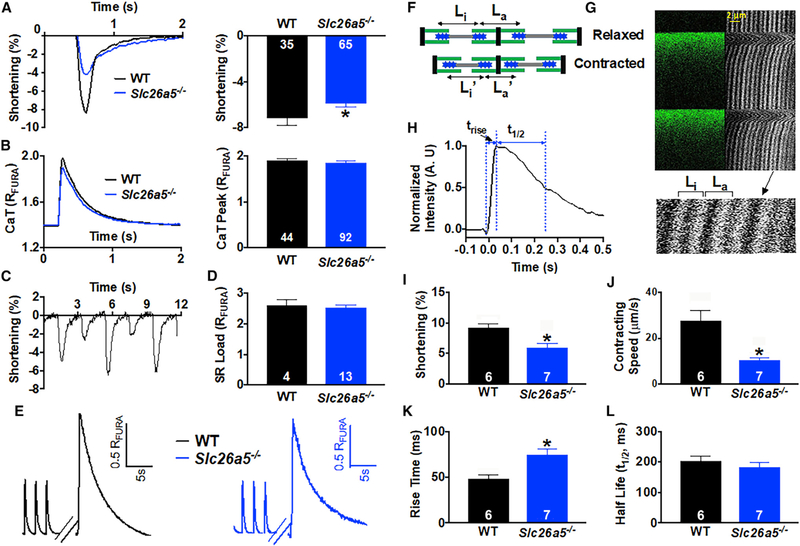
Figure 3. Slc26a5−/− cardiomyocytes show reduced sarcomere shortening.
(A and B) Representative traces for sarcomere shortening and Ca2+ transients (CaT) measured using Fura-2 ratio (RFURA) from WT and Slc26a5−/− cardiomyocytes. Summary data for percentages of sarcomere shortening and peak CaT from the two groups of animals are shown in the right panels.
(C) Examples of mechanical alternans in Slc26a5−/−cardiomyocytes. Alternans were not observed in WT cardiomyocytes.
(D) There were no significant differences in the sarcoplasmic reticulum (SR) Ca2+ load between WT and Slc26a5−/− cardiomyocytes.
(E) Representative traces of SR Ca2+ load measurement of WT and Slc26a5−/− ventricular myocytes. The myocytes were first paced to steady state. The pacing was stopped for 15 s, followed by a rapid application of 20 mM of caffeine to induce SR Ca2+ release.
(F) A diagram showing quantification of sarcomere shortening during relaxed and contracted states from SHG recordings. Li is the distance between 2 adjacent A-bands within the same sarcomere, while La is the distance between the 2 A-bands across the adjacent sarcomeres. The sarcomere length is equal to the sum of Li and La and shortens during cell contraction because of the sliding of the thick filament against the thin filament.
(G) A representative example of SHG recording and the corresponding Ca2+ transients from a ventricular myocyte.
(H) Quantification of the rise time (trise) and half decay time (t1/2) from a representative Ca2+ transient.
(I–L) Summary data comparing percentages of sarcomere shortening (I), contracting speed (μm/s) (J), CaT rise time (K), and CaT half decay time (L) from WT and Slc26a5−/− cardiomyocytes. *p < 0.05. The numbers within the bar graphs represent the sample sizes.

