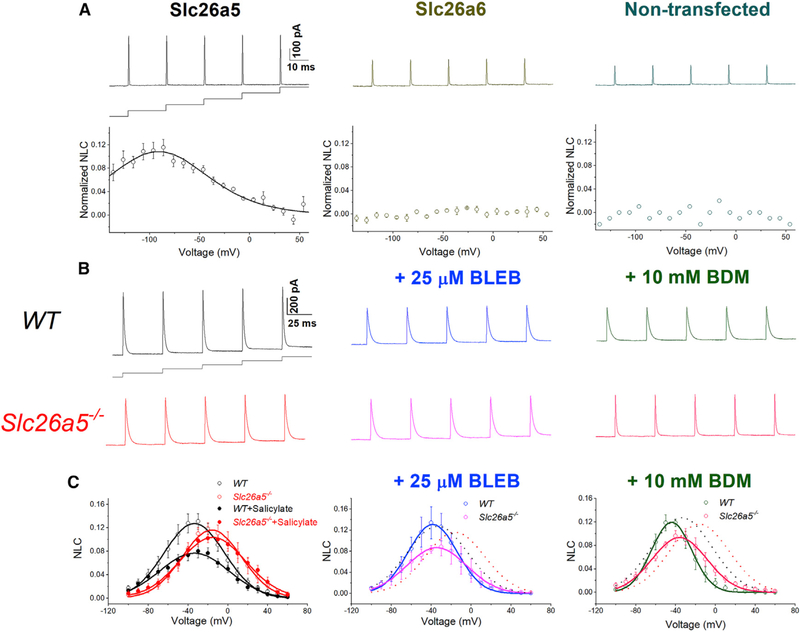
Figure 5. Voltage-dependent nonlinear capacitance (NLC) in CHO cells expressing Slc26a5 and in ventricular myocytes from WT and Slc26a5−/− mice.
(A) Upper panels show representative traces of NLC recordings using voltage stair protocol ranging from −140 to +60 mV with 10-mV increments, together with a diagram of the voltage-clamp protocol. Lower panels show normalized NLC, plotted as a function of voltage, and fitted with the first derivative of a Boltzmann function describing the nonlinear charge’s movement (Santos-Sacchi, 1991) as described below. The left panel shows normalized NLC from CHO cells expressing Slc26a5. CHO cells expressing Slc26a6 and non-transfected cells were used as negative controls and are shown in the middle and right panels, respectively. As expected, CHO cells expressing Slc26a6 do not demonstrate NLC.
(B) Representative traces of capacitive currents recorded from WT and Slc26a5−/− cardiomyocytes at baseline (left panels), after a 25-μM blebbistatin (BLEB, middle panels), and after a 10-mM BDM (right panels) application.
(C) NLC obtained through correction for linear capacitance was plotted as a function of voltage and fitted with the first derivative of a Boltzmann function: Cm = Cln + Cv = Cln + (Qmaxze/kT) × exp(−ze[V − Vh]/kT)/(1 + exp[−ze{V − Vh}/kT])2, where Cm is the total capacitance of the cell, Cln is the linear capacitance, Cv is the nonlinear capacitance, V is the membrane potential, Vh is the voltage at half-maximal nonlinear charge transfer, e is the electron charge, k is Boltzmann’s constant, T is the absolute temperature, z is the valence, and Qmax is maximum nonlinear charge transfer. Salicylate (10 mM) was applied to inhibit the NLC as shown in the left panel, showing no effect on Slc26a5−/− cardiomyocytes (n = 6 for WT and n = 5 for Slc26a5−/−). Knockout of Slc26a5 results in a significant reduction and depolarization shift of NLC (Vh = −37 ± 2 mV, n = 11; and −18 ± 3 mV, n = 14 for WT and Slc26a5−/−, respectively; p < 0.05); there are no significant changes in Cln (167 ± 15 pF for WT, and 166 ± 12 pF for Slc26a5−/−, n = 14); Qmax/Cln for WT is significantly larger than that of Slc26a5−/− (10.81 ± 0.99 versus 7.74 ± 1.03 nC/μF, p < 0.05; n = 11 for WT and n = 14 for Slc26a5−/−). In the presence of 10 mM salicylate, Qmax/Cln for WT cardiomyocytes is significantly reduced (7.21 ± 1.33 nC/μF, n = 6; p < 0.05), whereas Qmax/Cln for Slc26a5−/− cardiomyocytes is not significantly altered (7.56 ± 1.41 nC/μF, n = 5). The voltage sensitivity, K (kT/ze), can be calculated based on the z values with K = 17.16 ± 1.15 mV (n = 11 for WT) and 15.20 ± 1.31 mV (n = 14 for Slc26a5−/−), p = NS. Vh for WT and Slc26a5−/− ventricular myocytes after BLEB are −37 ± 5 (n = 4) and −25 ± 3 (n = 5) mV, respectively. Vh for WT and Slc26a5−/− ventricular myocytes after BDM are −43 ± 4 (n = 3) and −32 ± 3 (n = 7) mV, respectively. NLC for WT and Slc26a5−/− at baseline are shown in dotted lines in the middle and right panels. The NLC of Slc26a5−/− myocytes at −20, −10, 0, 10, 20, 30, and 40 mV in the presence of BLEB or BDM is significantly smaller than that in the absence of the myosin inhibitors (p < 0.05).

