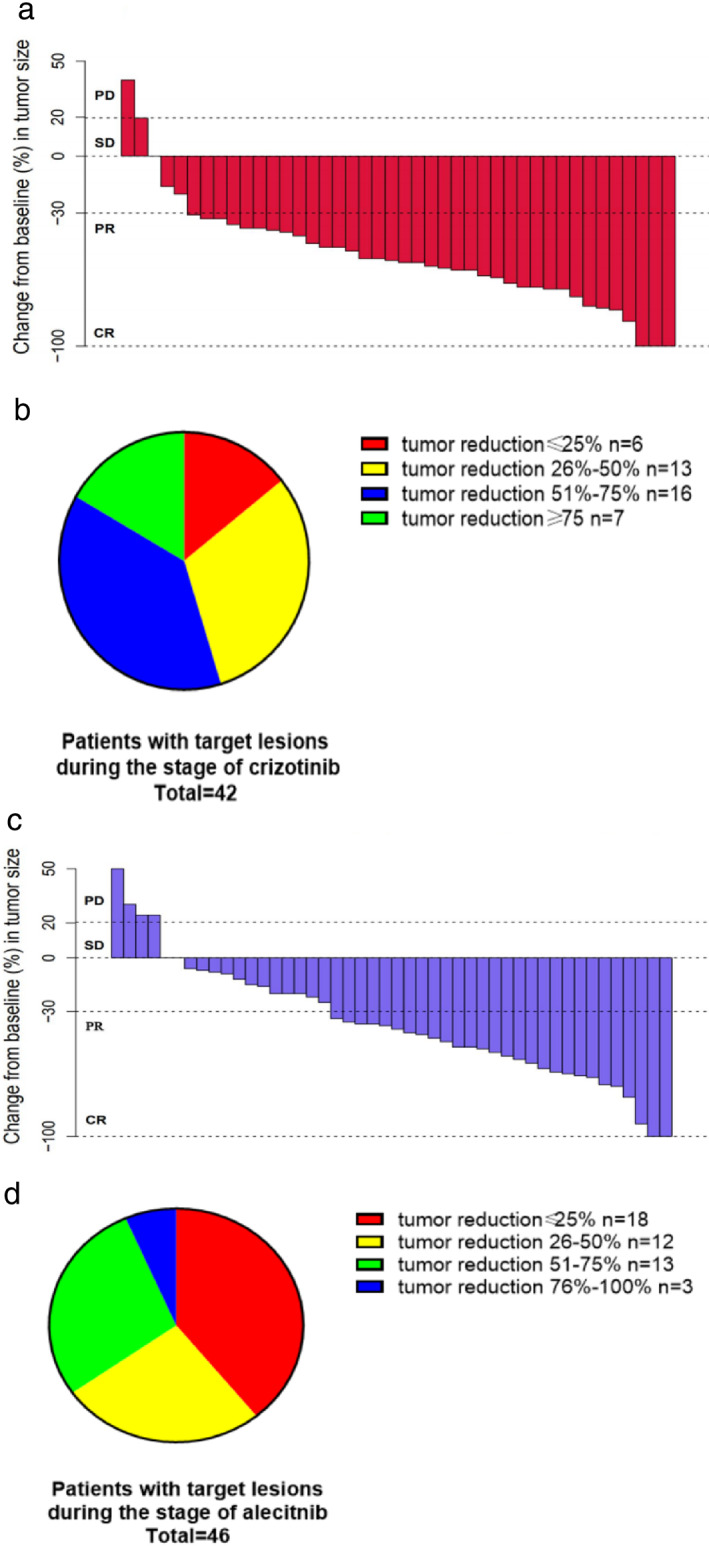
FIGURE 1.

(a) Waterfall plots for patients with target lesions during treatment with crizotinib (n = 42). (b) Extent of tumor reduction during treatment with crizotinib (n = 42). (c) Waterfall plots for patients with target lesions during treatment with alectinib. (d) Extent of tumor reduction during treatment with alecitnib (n = 46)
