FIGURE 6.

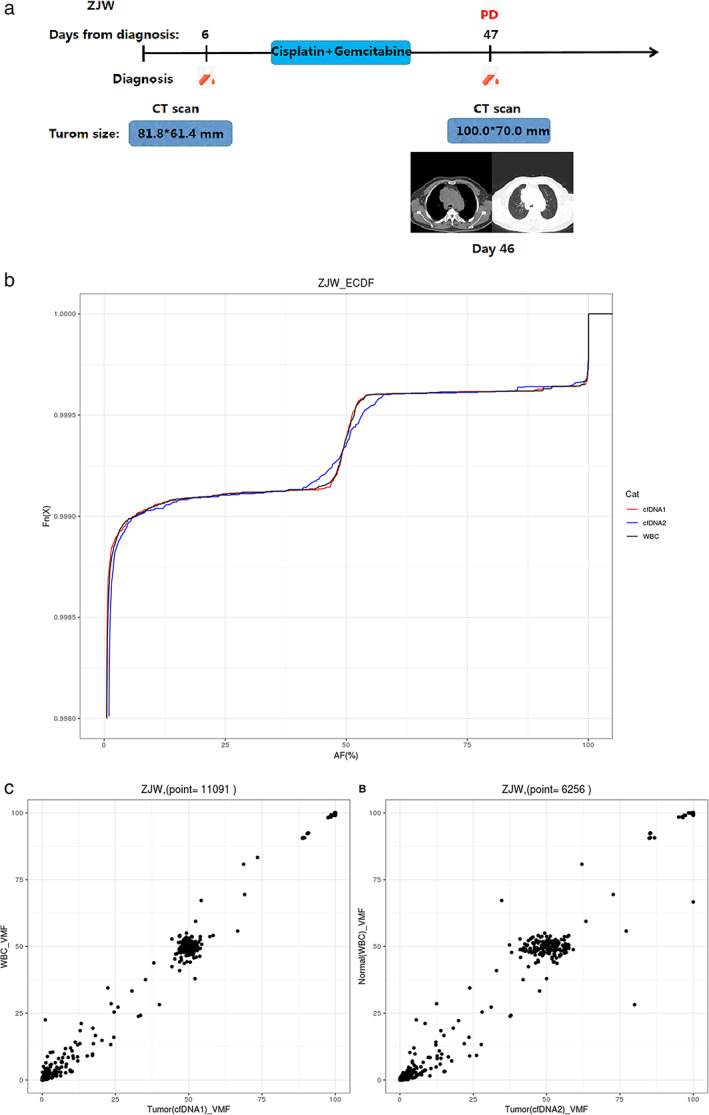
Longitudinal ctDNA analysis to monitor the response of a patient with lung cancer (ZJW) to chemotherapy. (a) Flow chart of the clinical course of patient ZJW, starting from the time of diagnosis and throughout the treatment. The light‐blue bars represent the treatment time frame, whereas the red dots indicate the time points of blood collection. Radiographic images were acquired at day 46. PD in red described the clinical outcome of chemotherapy in the patient. (b) Mutation allele frequency of patient ZJW during chemotherapy. The different colored curves correspond to different time points of blood collection. The abscissa is the variant allele frequency. The ordinate Fn (x) represents the cumulative percentage. (c) Frequency of tumor mutations compared with the normal control at different time points. VMF is variant mutation frequency
