Figure 8.

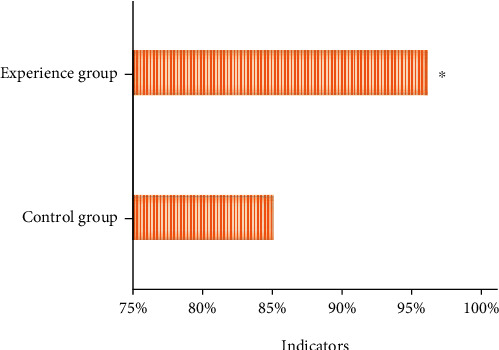
Comparison of the average accuracy index between the experimental group and the control group. ∗ indicates that the accuracy of the experimental group was significantly different from that of the control group (P < 0.05).

Comparison of the average accuracy index between the experimental group and the control group. ∗ indicates that the accuracy of the experimental group was significantly different from that of the control group (P < 0.05).