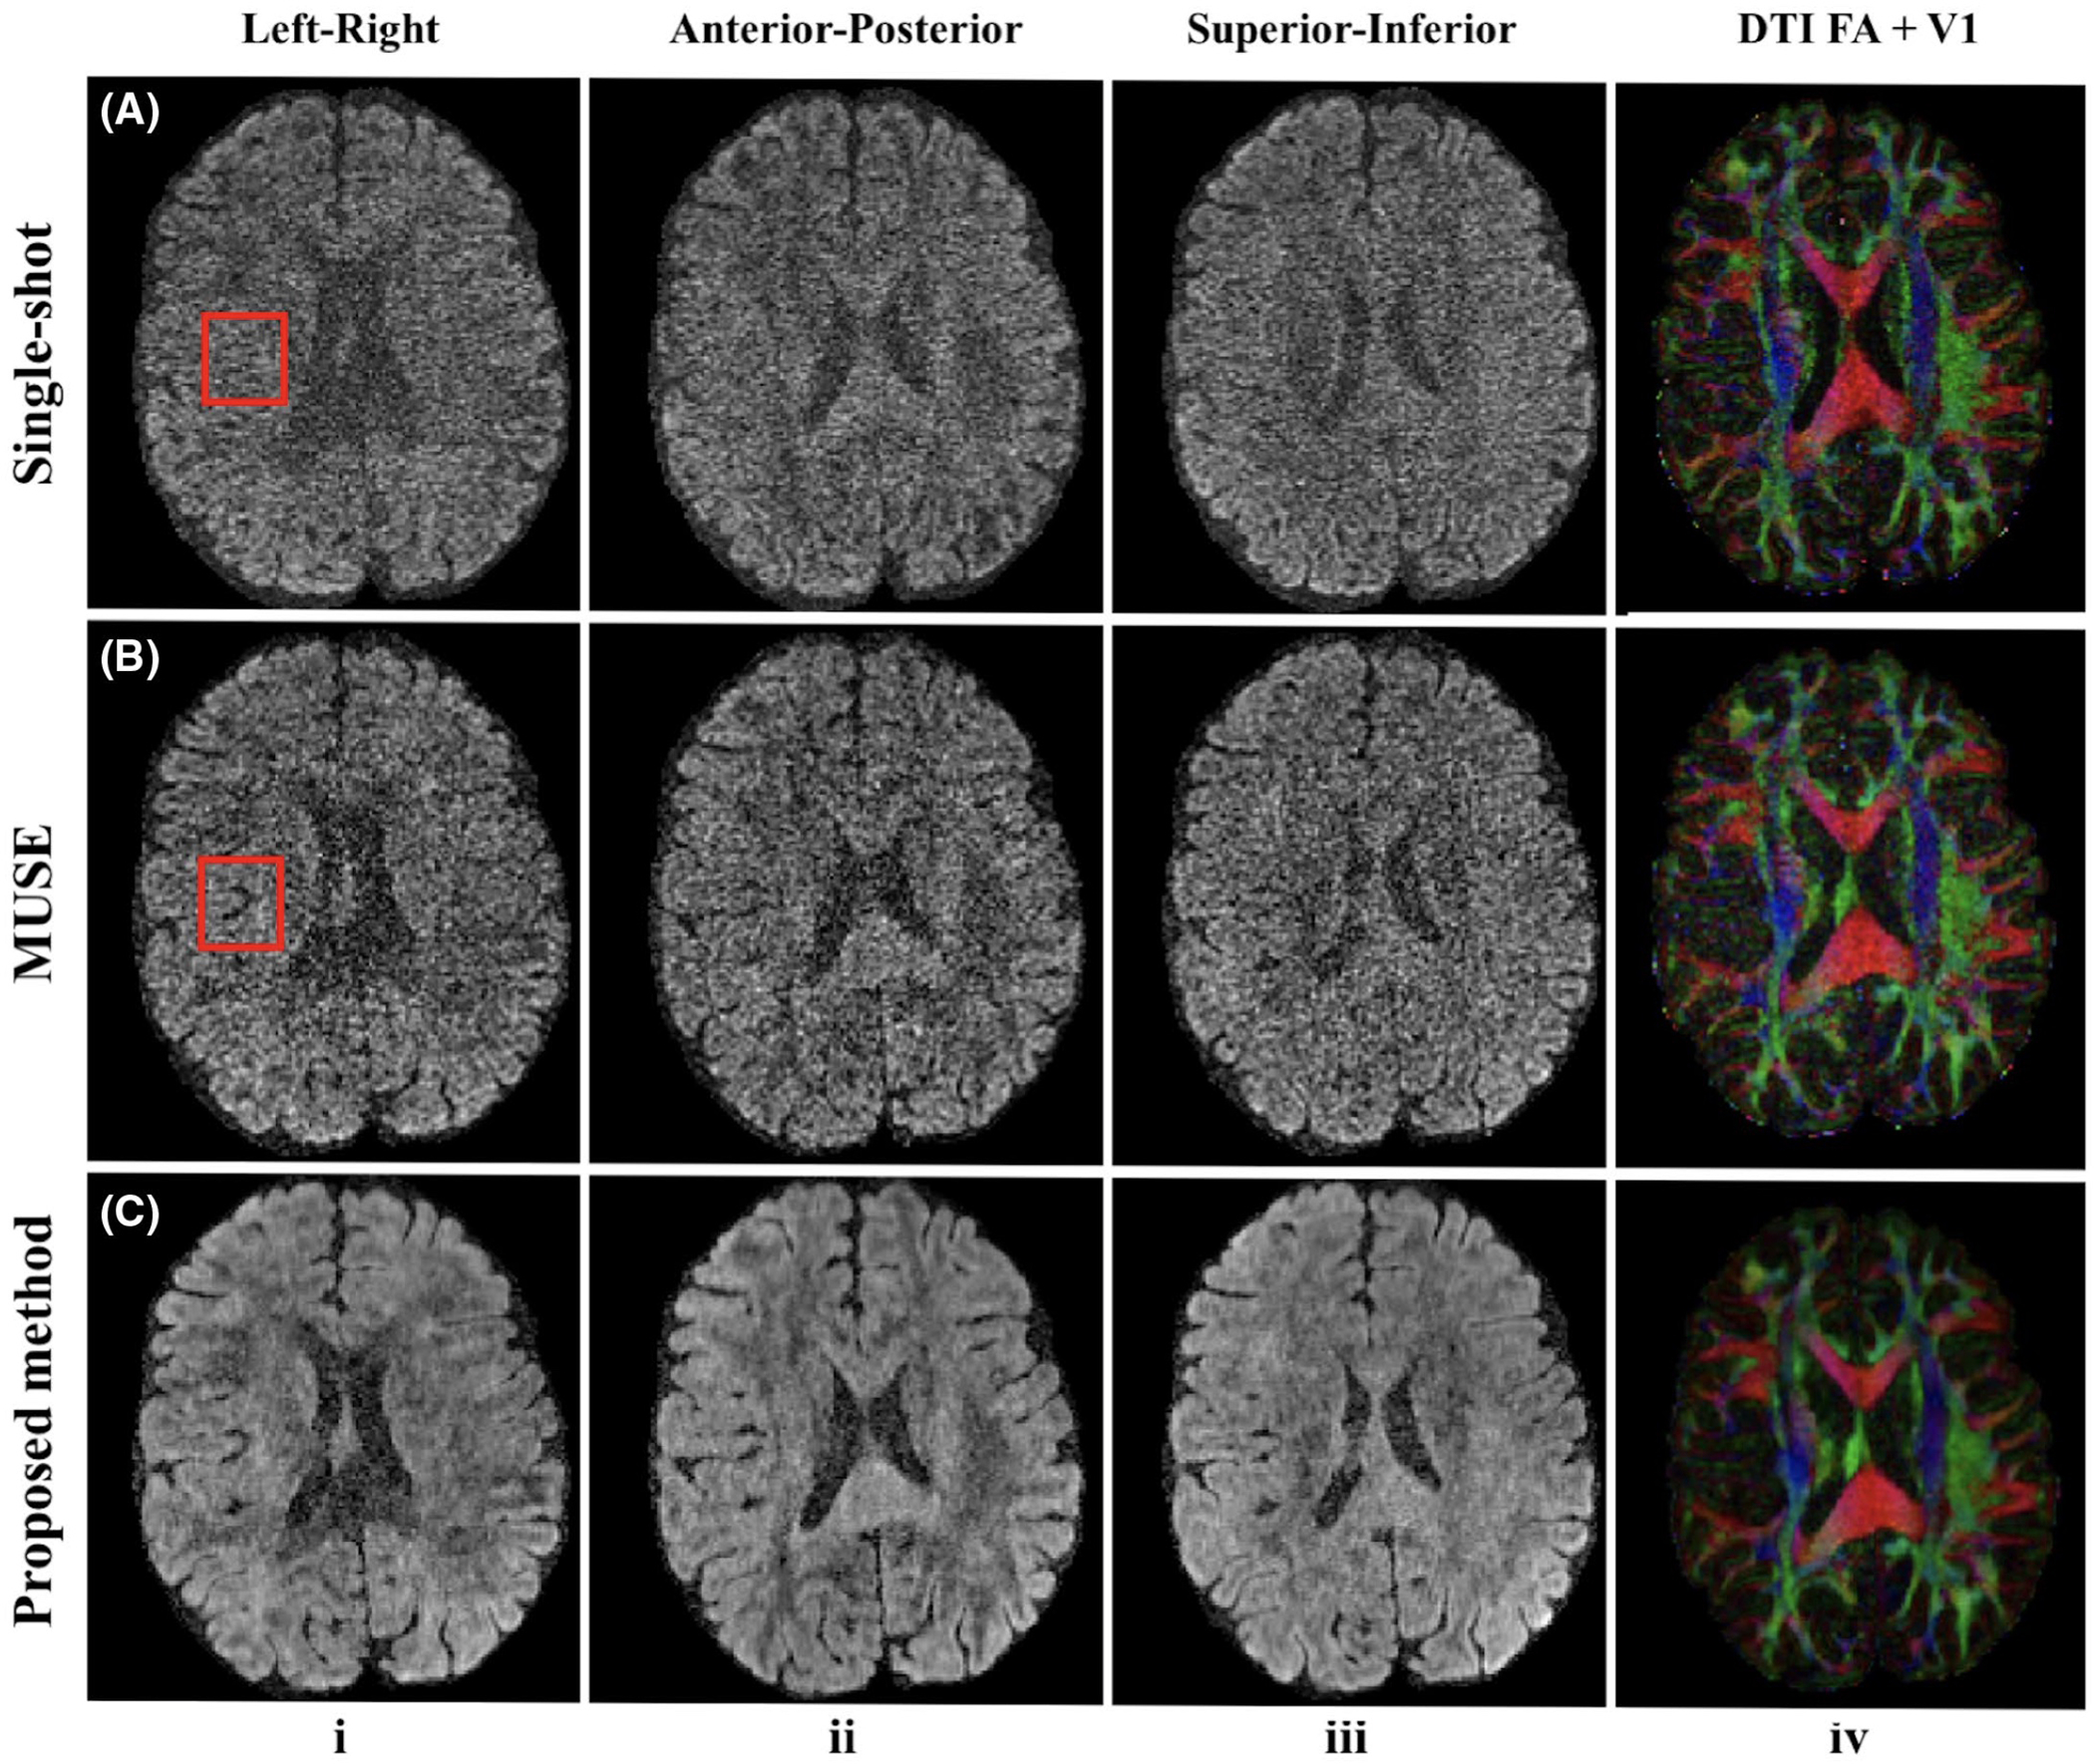
FIGURE 5.

Reconstructed DW images along left-right, anterior-posterior, superior-inferior diffusion-encoding directions out of 150 directions (columns i-iii) and corresponding color-encoded V1 maps weighted by FA (column iv). Row (A) shows single-shot results (R = 3, nex = 4), and the red box indicates the structure loss due to the high noise level. Rows (B) and (C) show four-shot results reconstructed by MUSE and the proposed method from Experiment 2 (1 mm isotropic resolution, 1,000 s∕mm2 b-value). Four-shot acquisition with the proposed reconstruction shows the least noisy results
