
FIGURE 7.
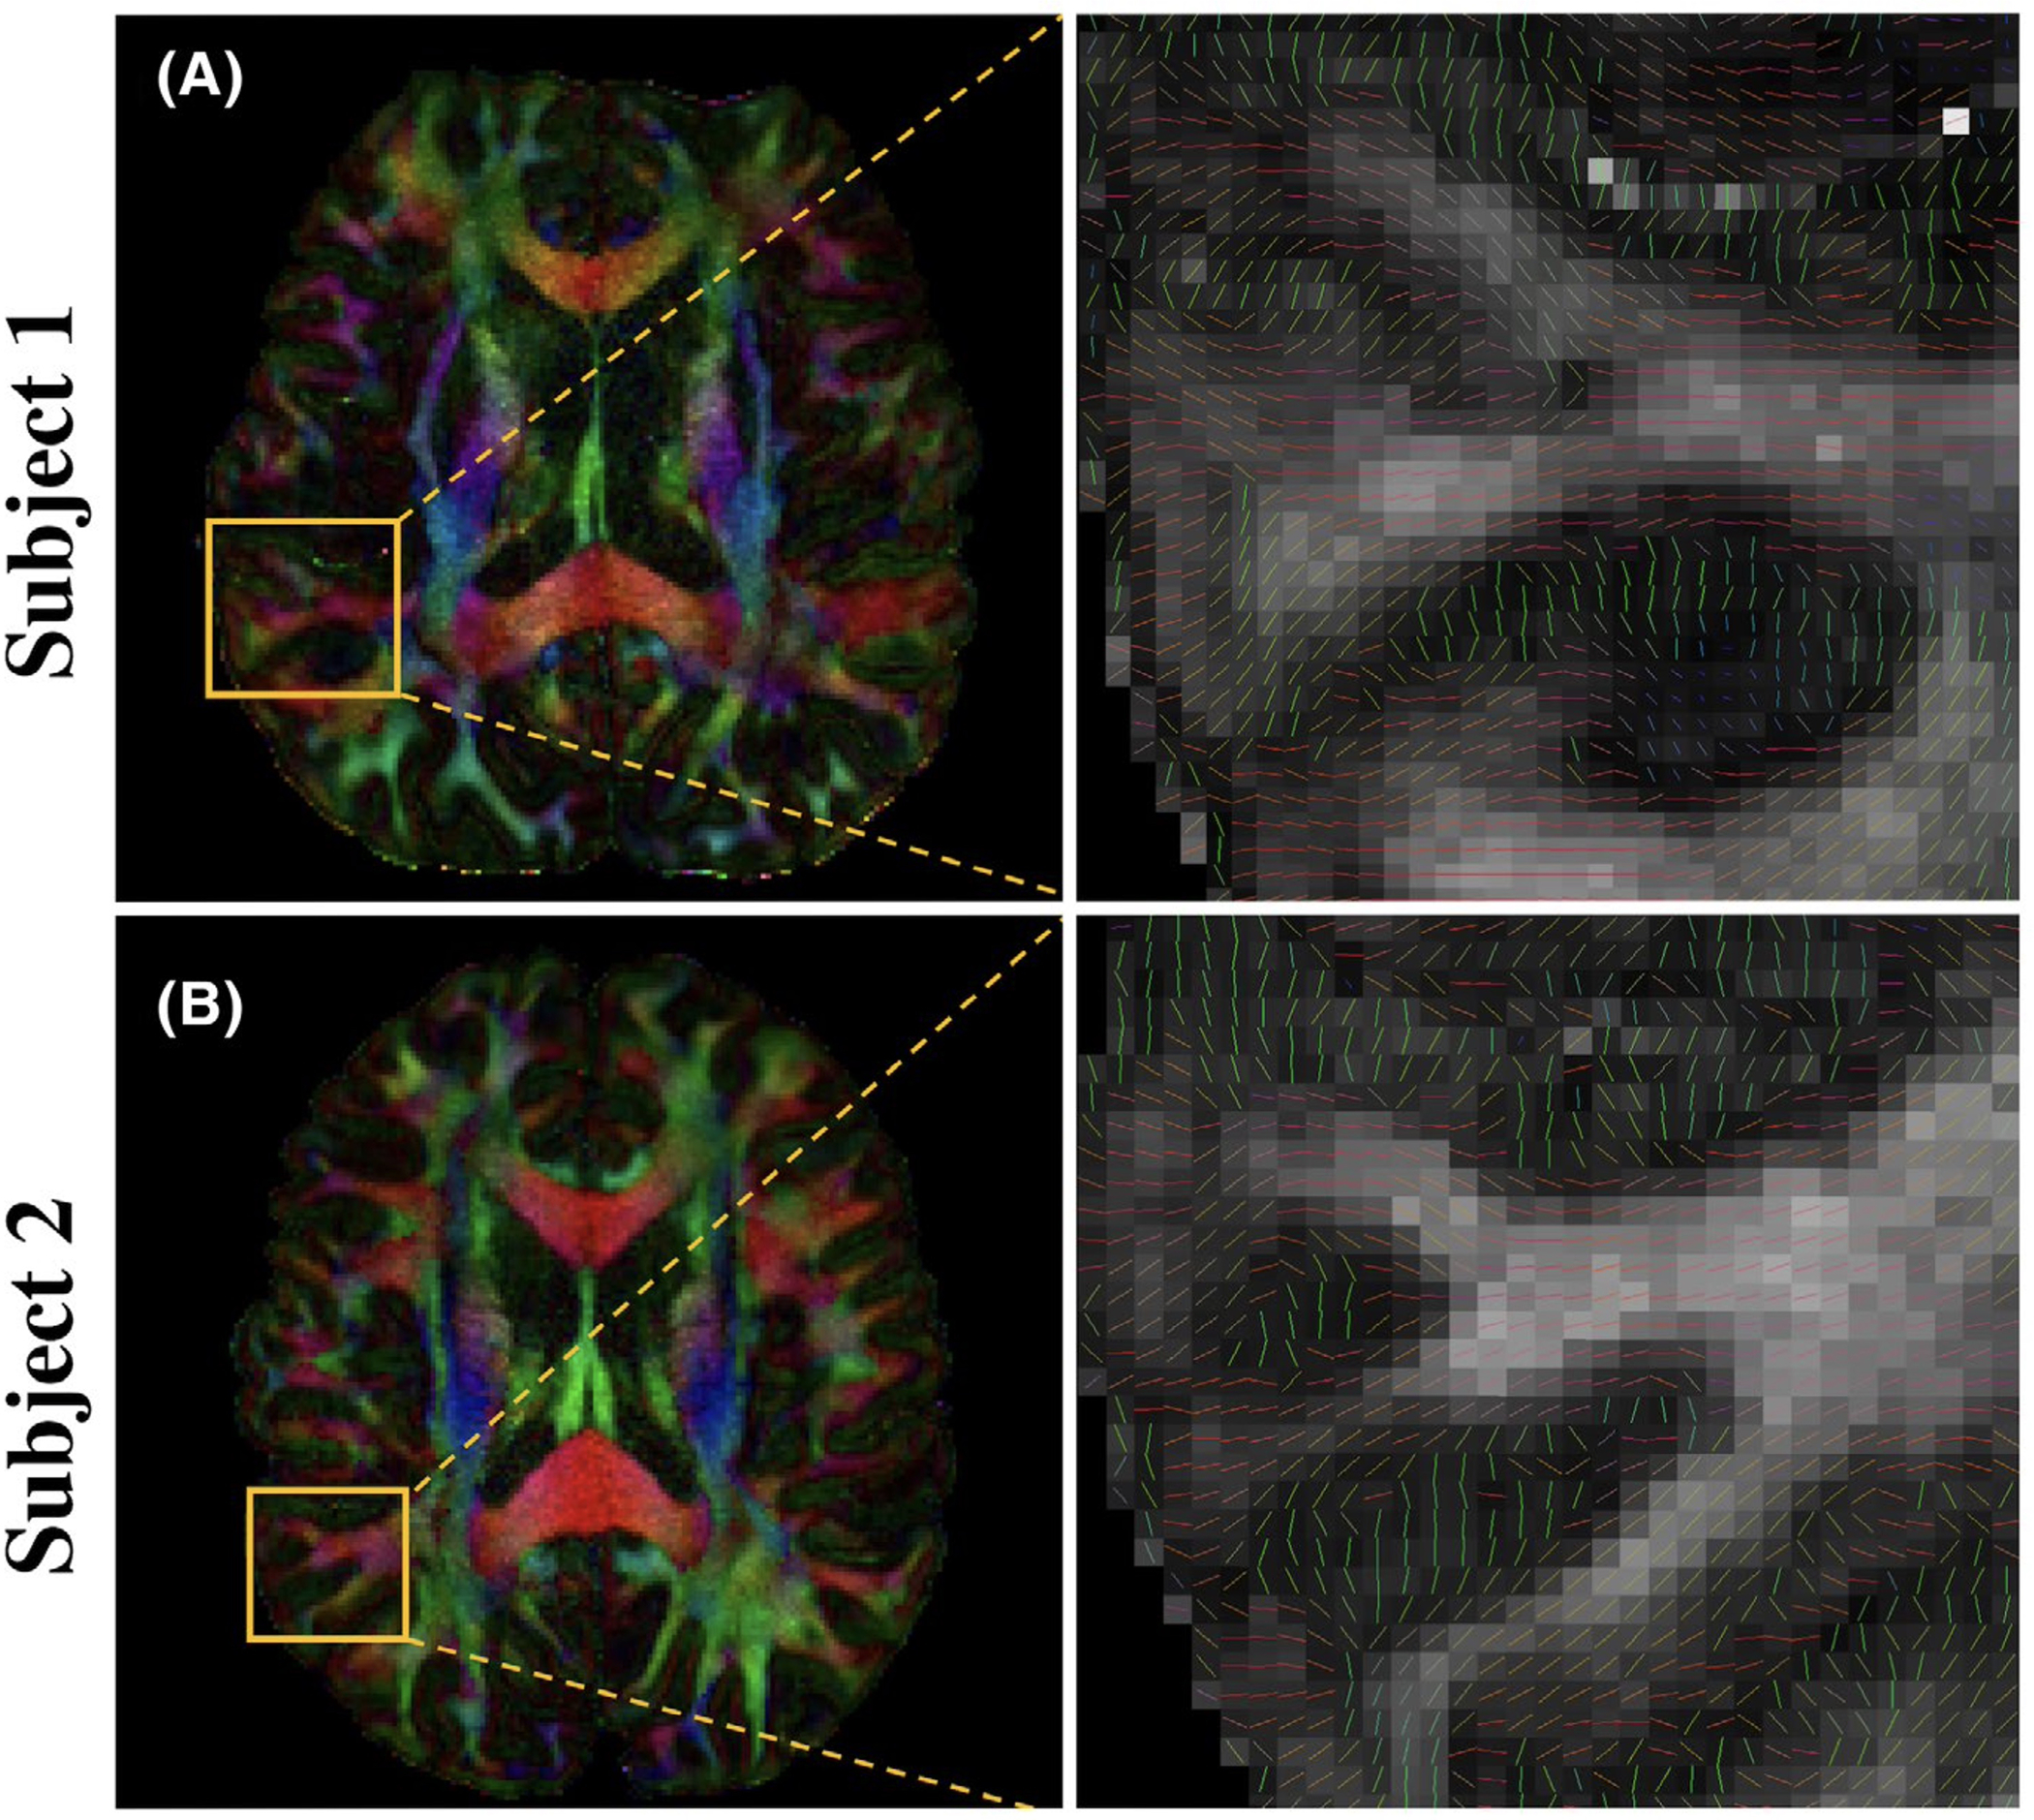
Color‐encoded V1 maps weighted by FA with 0.9 mm isotropic resolution and 150 diffusion‐encoding directions reconstructed by the proposed method on two subjects. The window level is tuned separately for better visual quality (0‐0.8 for subject 1, and 0‐1 for subject 2). The zoomed‐in view in the second column shows the primary eigenvector V1 in the cortex