Figure 1.
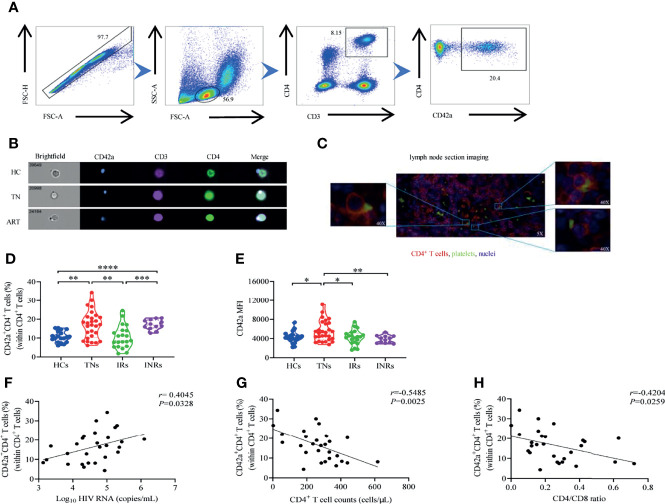
Detection of platelet-CD4 + T cell aggregates in HCs, TNs, IRs, and INRs. (A) Representative gating strategy for the flow cytometry analysis of platelet-CD4 + T cell aggregates and platelet-free CD4 + T cells from a TN patient. CD42a + CD4 + T cells represent platelet-CD4 + T cell aggregates while CD42a-CD4 + T cells represent platelet-free CD4 + T cells. (B) Representative image of circulating platelet-CD4 + T cell aggregates that came separately from HC and HIV-1-infected patients with or without ART as obtained from imaging flow cytometry. Platelets are recognized by anti-CD42a FITC (blue) while CD4 + T cells are recognized by anti-human CD3 BV510 (purple) and anti-human CD4 BV421 (green). (C) Representative images of platelet-CD4 + T cell aggregates in lymph nodes from an HIV-1-infected patient without ART as visualized via immunofluorescence microscopy. (D) Comparison of platelet-CD4 + T cell aggregate frequencies in CD4 + T cells from HCs (n=19), TNs (n=28), IRs (n=21) and INRs (n=12). (E) Median fluorescence intensity (MFI) values of CD42a were measured in all four groups. (F–H) Correlation between (F) HIV-1 viral load, (G) absolute CD4 + T cell counts, and (H) CD4/CD8 ratio with platelet-CD4 + T cell aggregate frequencies in TNs (n=28). *P < 0.05, **P ≤ 0.01, ***P ≤ 0.001, ****P ≤ 0.0001.

