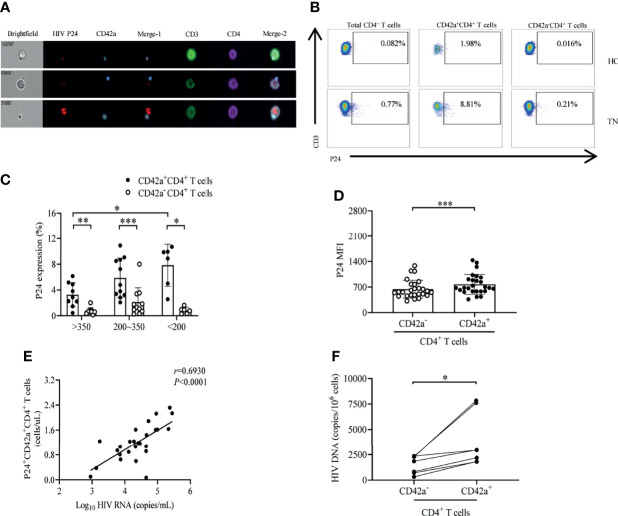
Figure 3.
Elevated levels of HIV-1 p24 and DNA in platelet-CD4+ T cell aggregates. (A) Representative images of p24 expression in platelet-CD4+ T cell aggregates via imaging flow cytometry from a treatment-naïve patient. Top row: p24 visualized only in the platelets of platelet-CD4+ T cell aggregates. Middle row: p24 visualized only in the CD4+ T cells. Bottom row: p24 visualized in both platelets and CD4+ T cells. (B) Representative gating strategy for p24 expression in platelet-CD4+ T cell aggregates and their counterparts from TNs and HCs. (C) P24 expression in platelet-CD4+ T cell aggregates and their counterparts in different groups of treatment-naïve HIV-1-infected subjects. CD4+ T cell counts>350 cells/μL (n=9), 200≤CD4+ T cell counts ≤ 350 cells/μL (n=11), CD4+ T cell counts<200 cells/μL (n=6). (D) Median fluorescence intensity (MFI) values of p24 were compared between platelet-CD4+ T cell aggregates and their counterparts in TNs (n=26). (E) Correlation between HIV-1 viral load and platelet-CD4+ T cell aggregates expressing p24 in TNs (n=26). (F) Platelet-CD4+ T cell aggregates and their counterparts were isolated from PBMCs of IRs (n=7); HIV-1 DNA was detected in these two cell fractions. *P < 0.05, **P ≤ 0.01, ***P ≤ 0.001.

