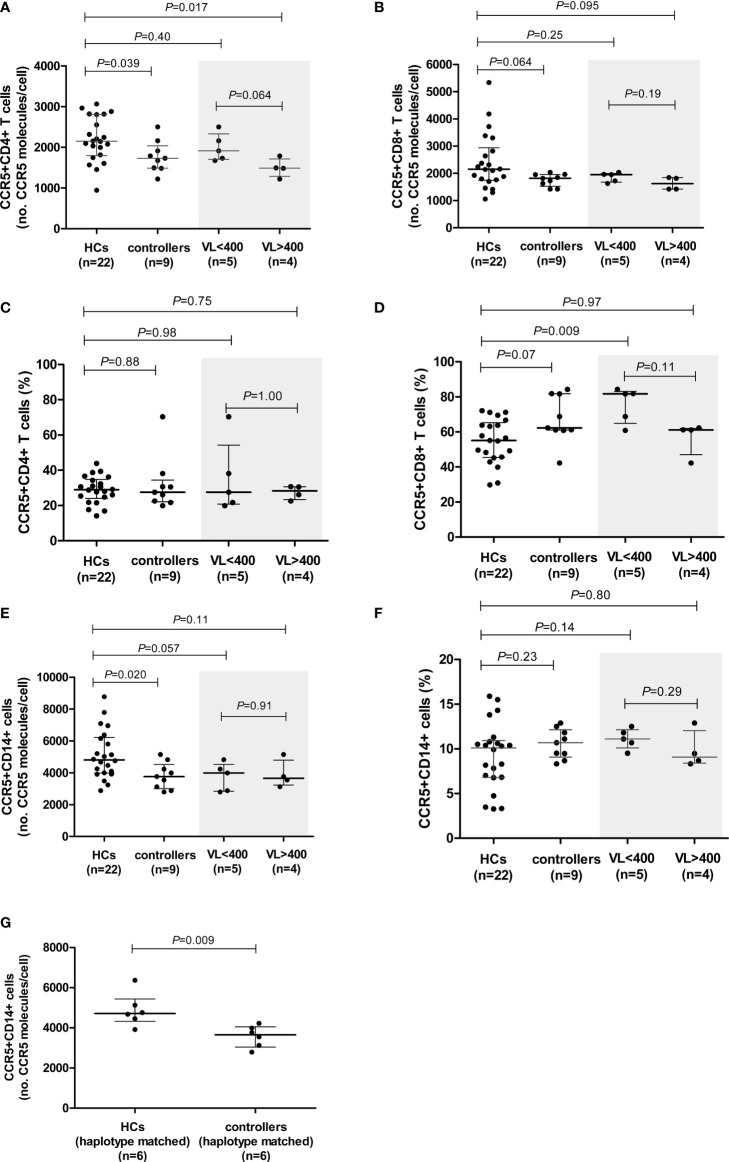
Figure 1.
CCR5 expression (density and percentage CCR5-expressing cells) on CD4+ (A, C) and CD8+ (B, D) T cells and monocytes (E, F) in healthy controls (HCs) and HIV-1 controllers (cohort 1). CCR5 expression for controllers, stratified according to viral load (VL), VL<400 and VL>400 (RNA copies/ml), is shaded in grey. CCR5 density on monocytes in HCs and HIV-1 controllers matched for CCR5 genotype (G). Mann-Whitney U-tests were conducted to test for significance. The medians and interquartile ranges are shown by horizontal bars. P values and the number of individuals in each group are indicated.

