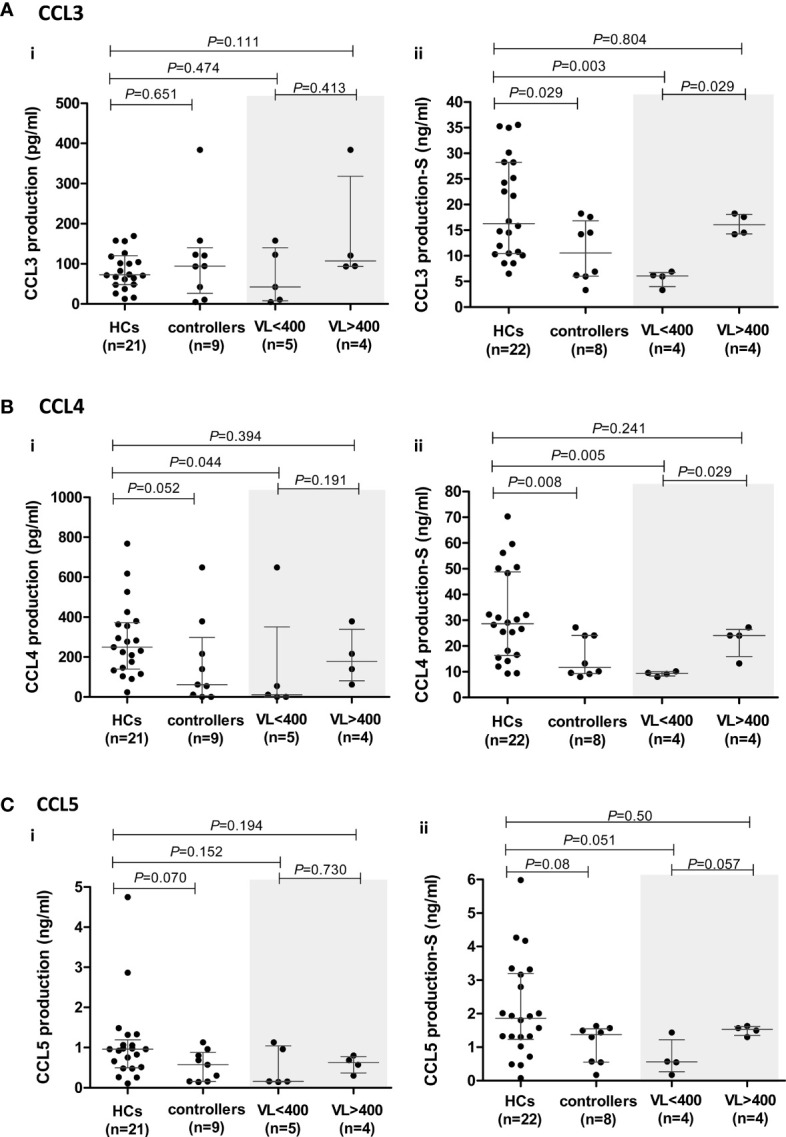
Figure 4.

CCR5 ligand production by peripheral blood mononuclear cells (PBMCs) isolated from healthy controls (HCs) and HIV-1 controllers (cohort 1): CCL3 (A), CCL4 (B) and CCL5 (C). Overall cytokine production is shown for unstimulated (spontaneous) (i) and PHA-stimulated (S) (ii) PBMCs. Mann-Whitney U-tests were conducted to test for significance. The medians and interquartile ranges are shown by horizontal bars. P values and the number of individuals in each group are indicated. Due to insufficient sample, a single control individual was omitted from the unstimulated production assays. A Controller (TG4), considered an outlier, was omitted from the PHA-stimulated comparisons (hence, n=8). Chemokine production from controllers stratified according to viral load (VL), VL<400 and VL>400 (RNA copies/ml) are shown within the grey shaded boxes.
