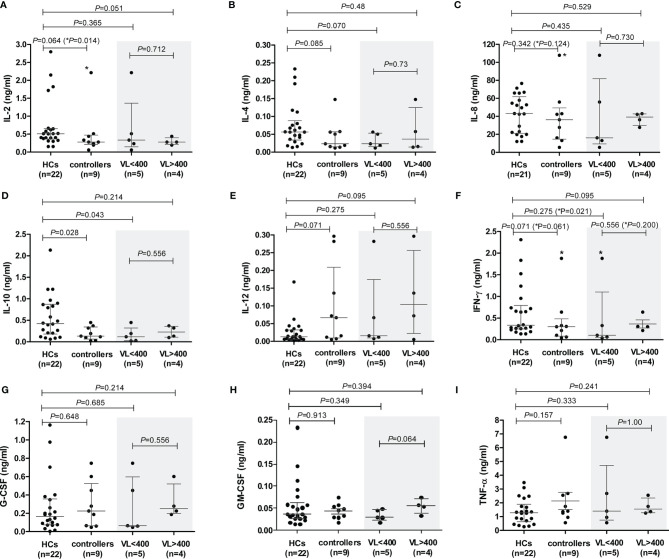
Figure 5.
PHA-induced cytokine production by peripheral blood mononuclear cells (PBMCs) isolated from healthy controls (HCs) and HIV-1 controllers (cohort 1): IL-2 (A), IL-4 (B), IL-8 (C), IL-10 (D), IL-12 (E), IFN-γ (F), G-CSF (G), GM-CSF (H) and TNF-α (I). Mann-Whitney U-tests were conducted to test for significance. The medians and interquartile ranges are shown by horizontal bars. P values and the number of individuals in each group are indicated. Chemokine production from controllers stratified according to viral load (VL), VL<400 and VL>400 (RNA copies/ml) are shown within the grey shaded boxes. P values following the removal of the TG4 controller outlier as indicated with an asterisk (*) in (A, C, F).

